Here is an overview of this program at Pierpont Community and Technical College. You can study it at the Associate’s level. At its best it places at #2 out of 7 schools (Associate’s level) by College Factual. Jump to any of the following sections:
College Factual ranks Pierpont Community and Technical College highly for allied health services, coming in at #227 out of 508 schools nationally.
The following degree levels are offered in allied health services at Pierpont Community and Technical College, along with how many graduates complete each level annually.
| Degree Level | Annual Graduates |
|---|---|
| Associate’s | 19 |
During the most recent reporting year, Pierpont Community and Technical College conferred 19 associate’s degrees in allied health services.
Pierpont Community and Technical College ranks competitively among schools offering allied health services at the associate’s level. Specifically, it ranked #2 out of 7 schools by College Factual.
Average full-time tuition and fees are listed in the table below.
| In State | Out of State | |
|---|---|---|
| Tuition | $3,912 | $11,730 |
| Fees | $1,014 | $1,930 |
Learn more about Pierpont Community and Technical College tuition and fees.
For the most recent academic year available, 32% of allied health services associate’s degrees went to men and 68% went to women.
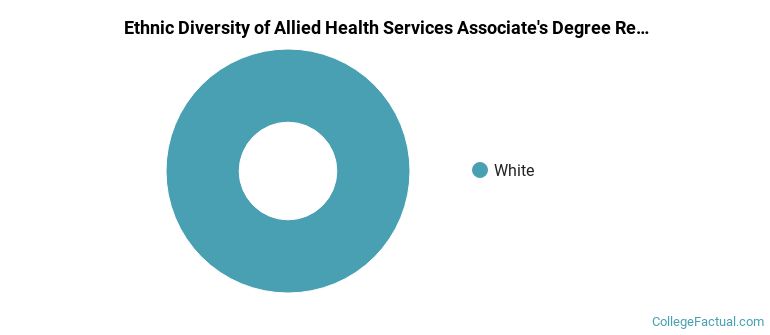
 The largest share of allied health services associate’s degree graduates at Pierpont Community and Technical College are White. About 100% of graduates fell into this category.
The following table and chart show the ethnic background for students who recently graduated from Pierpont Community and Technical College with a associate’s in allied health services.
| Ethnic Background | Number of Students |
|---|---|
| Asian | 0 |
| Black or African American | 0 |
| Hispanic or Latino | 0 |
| White | 19 |
| Non-Resident Aliens | 0 |
| Other Races | 0 |
Pierpont Community and Technical College awarded 11 associate’s completions in physical therapy assistant recently — 64% to women and 36% to men. The most common background among these graduates was White (100%).
Pierpont Community and Technical College granted 8 associate’s completions in allied health and medical assisting services, other in the latest year of data — 75% to women and 25% to men. The largest share of these graduates were White (100%).
More about our data sources and methodologies.