Here is an overview of this program at Rutgers, The State University of New Jersey; Rutgers, The State University; Rutgers University; Rutgers U; Rutgers; Rutgers–New Brunswick; Rutgers, New Brunswick; Rutgers New Brunswick. It is offered at the Bachelor’s level. At its best it places at #1 out of 8 schools (Bachelor’s level) by College Factual. Jump to any of the following sections:
College Factual rates Rutgers, The State University of New Jersey; Rutgers, The State University; Rutgers University; Rutgers U; Rutgers; Rutgers–New Brunswick; Rutgers, New Brunswick; Rutgers New Brunswick as a strong choice for design & applied arts, placing at #129 out of 558 schools nationally.
| Ranking | Rank |
|---|---|
| Best Design & Applied Arts Schools | 129 of 558 |
| Best Design & Applied Arts Schools in New Jersey | 3 of 15 |
| Best Design & Applied Arts Schools in the Middle Atlantic Region | 21 of 95 |
The following degree levels are granted in design & applied arts at Rutgers, The State University of New Jersey; Rutgers, The State University; Rutgers University; Rutgers U; Rutgers; Rutgers–New Brunswick; Rutgers, New Brunswick; Rutgers New Brunswick, along with how many graduates complete each level annually.
| Degree Level | Annual Graduates |
|---|---|
| Bachelor’s | 16 |
During the most recent reporting year, Rutgers University-New Brunswick handed out 16 bachelor’s degrees in design & applied arts.
Rutgers, The State University of New Jersey; Rutgers, The State University; Rutgers University; Rutgers U; Rutgers; Rutgers–New Brunswick; Rutgers, New Brunswick; Rutgers New Brunswick is among the very best schools in the country for design & applied arts at the bachelor’s level. Specifically, it ranked #1 out of 8 schools by College Factual.
While getting their bachelor’s degree at Rutgers, The State University of New Jersey; Rutgers, The State University; Rutgers University; Rutgers U; Rutgers; Rutgers–New Brunswick; Rutgers, New Brunswick; Rutgers New Brunswick, design & applied arts students accumulate a median of $27,000 in student loans. This is above $25,162, the typical median for all majors at Rutgers, The State University of New Jersey; Rutgers, The State University; Rutgers University; Rutgers U; Rutgers; Rutgers–New Brunswick; Rutgers, New Brunswick; Rutgers New Brunswick.

The full-time undergraduate tuition and fees are shown below.
| In State | Out of State | |
|---|---|---|
| Tuition | $12,536 | $33,734 |
| Fees | $3,707 | $3,707 |
In the most recent graduating class, 25% of design & applied arts bachelor’s degrees went to men and 75% went to women.
 The largest share of design & applied arts bachelor’s degree graduates at Rutgers, The State University of New Jersey; Rutgers, The State University; Rutgers University; Rutgers U; Rutgers; Rutgers–New Brunswick; Rutgers, New Brunswick; Rutgers New Brunswick are Asian. Roughly 56% of graduates fell into this category.
The following table and chart show the ethnic background for students who recently graduated from Rutgers University-New Brunswick with a bachelor’s in design & applied arts.
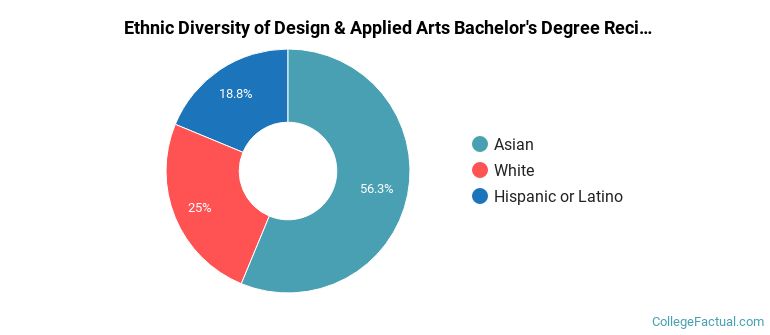
| Ethnic Background | Number of Students |
|---|---|
| Asian | 9 |
| Black or African American | 0 |
| Hispanic or Latino | 3 |
| White | 4 |
| Non-Resident Aliens | 0 |
| Other Races | 0 |
Rutgers, The State University of New Jersey; Rutgers, The State University; Rutgers University; Rutgers U; Rutgers; Rutgers–New Brunswick; Rutgers, New Brunswick; Rutgers New Brunswick awarded 16 bachelor’s degrees in design and visual communications, general in the latest year of data — 75% to women and 25% to men. The largest share of these graduates were Asian (56%).