Explore the best ranked schools for the programs you are most interested in.
According to College Factual's 2025 analysis, Smith is ranked #397 out of 2,152 schools in the nation that were analyzed for overall quality. This puts it in the top 20% of all schools in the nation.
Smith also holds the #21 spot on the Best Colleges in Massachusetts ranking.
Even if you have the best grades and high test scores, that may not be enough to get into Smith since the school has one of the most selective in the country. Its acceptance rate is a mere 23%, so there's no shame if you don't get in. Be sure to apply to other schools just in case.
About 33% of students accepted to Smith submitted their SAT scores. When looking at the 25th through the 75th percentile, SAT Evidence-Based Reading and Writing scores ranged between 700 and 760. Math scores were between 670 and 760.
At Smith, the student to faculty ratio is an excellent 8 to 1. That's much better than the national average of 15 to 1. This indicates that many classes will probably be small, and students will have ample opportunites to work closely with their professors and classmates.
In addition to the student to faculty ratio, some people look at what percentage of faculty members are full-time as a sign of how much time professors will be able to spend with their students. This is because part-time teachers may not be be on campus as much as their full-time counterparts.
The full-time faculty percentage at Smith College is 82%. This is higher than the national average of 47%.
The freshmen retention rate of 91% tells us that most first-year, full-time students like Smith College enough to come back for another year. This is a fair bit higher than the national average of 68%. That's certainly something to check off in the good column about the school.
The on-time graduation rate for someone pursuing a bachelor's degree is typically four years. This rate at Smith for first-time, full-time students is 82%, which is better than the national average of 33.3%.
Find out more about the retention and graduation rates at Smith College.
During the 2017-2018 academic year, there were 2,183 undergraduates at Smith with 2,160 being full-time and 23 being part-time.
| $0-30 K | $30K-48K | $48-75 | $75-110K | $110K + |
|---|---|---|---|---|
| $14,214 | $14,016 | $14,098 | $23,430 | $46,976 |
The net price is calculated by adding tuition, room, board and other costs and subtracting financial aid.Note that the net price is typically less than the published for a school. For more information on the sticker price of Smith, see our tuition and fees and room and board pages.
Almost 66% of college students who graduated with the class of 2018 took out student loans, but that percentage varies from school to school. At Smith, approximately 39% of students took out student loans averaging $4,482 a year. That adds up to $17,928 over four years for those students.
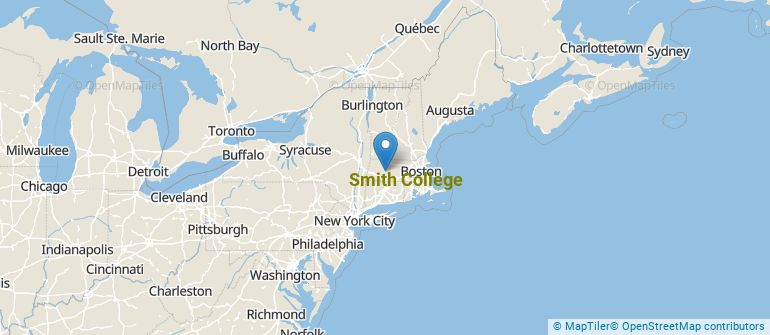
Get more details about the location of Smith College.
Contact details for Smith are given below.
| Contact Details | |
|---|---|
| Address: | Elm St, Northampton, MA 01063 |
| Phone: | 413-584-2700 |
| Website: | www.smith.edu/ |
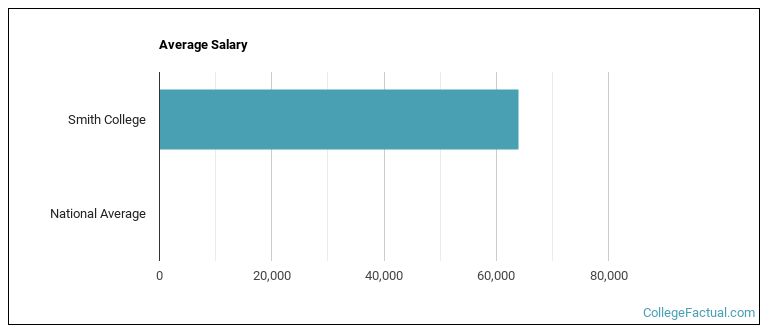
| Most Popular Majors | Bachelor’s Degrees | Average Salary of Graduates |
|---|---|---|
| Social Work | 108 | NA |
| Political Science & Government | 76 | $42,327 |
| General Biology | 52 | $32,747 |
| Child Development & Psychology | 44 | $43,717 |
| Economics | 43 | $71,559 |
| Computer Science | 41 | $66,981 |
| General English Literature | 40 | $25,023 |
| Data Science | 38 | NA |
| Mathematics | 36 | NA |
| Fine & Studio Arts | 36 | $20,171 |
Footnotes
*The racial-ethnic minorities count is calculated by taking the total number of students and subtracting white students, international students, and students whose race/ethnicity was unknown. This number is then divided by the total number of students at the school to obtain the racial-ethnic minorities percentage.
References
More about our data sources and methodologies.
