Below are the key facts about this program at Buffalo State University. Degrees are awarded at the Bachelor’s, Undergraduate Certificate levels, with graduate study also available. It ranks as high as #32 out of 33 schools (Bachelor’s level) by College Factual. Jump to any of the following sections:
College Factual rates Buffalo State University highly for teacher education subject specific, placing at #379 out of 554 schools nationally.
The table below lists every degree level granted in teacher education subject specific at Buffalo State University, along with how many graduates complete each level annually.
| Degree Level | Annual Graduates |
|---|---|
| Bachelor’s | 55 |
| Undergraduate Certificate | 6 |
| Master’s | 74 |
During the most recent reporting year, SUNY Buffalo State University awarded 55 bachelor’s degrees in teacher education subject specific.
Buffalo State University ranks competitively among schools offering teacher education subject specific at the bachelor’s level. Its best result was #32 out of 33 schools by College Factual.
Teacher Education Subject Specific majors who earn their bachelor’s degree from Buffalo State University earn a median of $46,630 a year. This is above $46,567, the median for all majors at Buffalo State University.
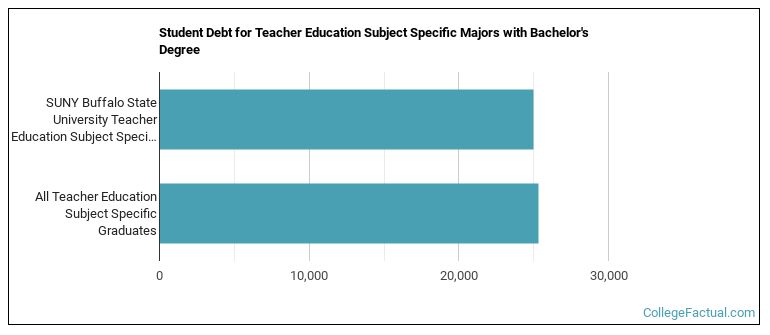
To complete a bachelor’s at Buffalo State University, teacher education subject specific graduates take on a median debt of $25,000 in student loans. This is below $25,326, the typical median for all majors at Buffalo State University.
Average full-time tuition and fees are listed in the table below.
| In State | Out of State | |
|---|---|---|
| Tuition | $7,070 | $18,190 |
| Fees | $1,463 | $1,463 |
Read more about Buffalo State University tuition and fees.
For the most recent academic year available, 35% of teacher education subject specific bachelor’s degrees went to men and 65% went to women.
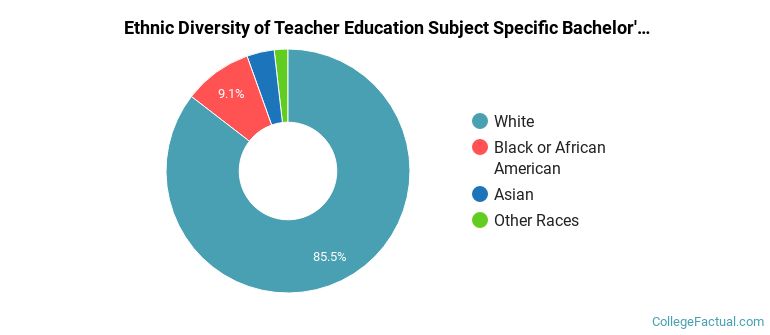
 The largest share of teacher education subject specific bachelor’s degree graduates at Buffalo State University are White. About 85% of graduates fell into this category.
The following table and chart show the ethnic background for students who recently graduated from SUNY Buffalo State University with a bachelor’s in teacher education subject specific.
| Ethnic Background | Number of Students |
|---|---|
| Asian | 2 |
| Black or African American | 5 |
| Hispanic or Latino | 0 |
| White | 47 |
| Non-Resident Aliens | 0 |
| Other Races | 1 |
Buffalo State University conferred 12 bachelor’s completions in social studies teacher education recently — 67% to women and 33% to men. The largest share of these graduates were White (100%).
Buffalo State University conferred 12 bachelor’s degrees in technology teacher education/industrial arts teacher education in the most recent reporting year — 17% to women and 83% to men. The largest share of these graduates were White (92%).
Buffalo State University granted 9 bachelor’s completions in art teacher education in the latest year of data — 89% to women and 11% to men. Most of these graduates identified as White (100%).
Buffalo State University conferred 7 bachelor’s degrees in english/language arts teacher education in the most recent reporting year — 86% to women and 14% to men. The most common background among these graduates was White (43%).
Buffalo State University awarded 7 bachelor’s completions in music teacher education in the latest year of data — 71% to women and 29% to men. The most common background among these graduates was White (86%).
Buffalo State University conferred 6 bachelor’s completions in mathematics teacher education in the latest year of data — 83% to women and 17% to men. Most of these graduates identified as White (67%).
Buffalo State University granted 2 bachelor’s completions in family and consumer sciences/home economics teacher education recently — 100% to women and 0% to men. The most common background among these graduates was White (100%).
During the most recent reporting year, SUNY Buffalo State University awarded 6 undergraduate certificate degrees in teacher education subject specific.
Buffalo State University is not currently ranked for teacher education subject specific at the undergraduate certificate level.
Among recent graduates, 17% of teacher education subject specific undergraduate certificate degrees went to men and 83% went to women.
 The largest share of teacher education subject specific undergraduate certificate degree graduates at Buffalo State University were White. Approximately 100% of graduates fell into this category.
The following table and chart show the ethnic background for students who recently graduated from SUNY Buffalo State University with a undergraduate certificate in teacher education subject specific.

| Ethnic Background | Number of Students |
|---|---|
| Asian | 0 |
| Black or African American | 0 |
| Hispanic or Latino | 0 |
| White | 6 |
| Non-Resident Aliens | 0 |
| Other Races | 0 |
Buffalo State University awarded 5 undergraduate certificate completions in art teacher education in the latest year of data — 80% to women and 20% to men. The largest share of these graduates were White (100%).
Buffalo State University awarded 1 undergraduate certificate completion in business and innovation/entrepreneurship teacher education in the most recent reporting year — 100% to women and 0% to men. Most of these graduates identified as White (100%).
This program is also offered at the graduate level at Buffalo State University. Annual graduate completions by level are shown below.
| Graduate Level | Annual Graduates |
|---|---|
| Master’s Degrees in Teacher Education Subject Specific | 74 |
