Jump to any of the following sections:
The personal & culinary services major at SUNY Delhi is not ranked on College Factual’s Best Colleges and Universities for Personal & Culinary Services. This could be for a number of reasons, such as not having enough data on the major or school to make an accurate assessment of its quality.
During the 2021-2022 academic year, SUNY Delhi handed out 13 bachelor's degrees in personal & culinary services. This is a decrease of 19% over the previous year when 16 degrees were handed out.
During the 2022-2023 academic year, part-time undergraduate students at SUNY Delhi paid an average of $452 per credit hour if they came to the school from out-of-state. In-state students paid a discounted rate of $295 per credit hour. The following table shows the average full-time tuition and fees for undergraduates.
| In State | Out of State | |
|---|---|---|
| Tuition | $7,070 | $10,840 |
| Fees | $1,640 | $1,640 |
| Books and Supplies | $1,300 | $1,300 |
| On Campus Room and Board | $14,590 | $14,590 |
| On Campus Other Expenses | $2,856 | $2,856 |
Learn more about SUNY Delhi tuition and fees.
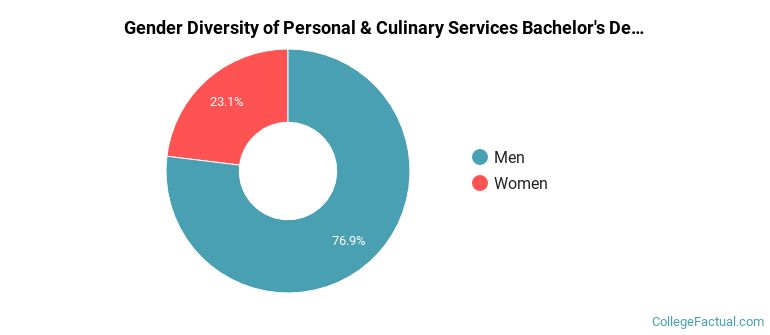
During the 2021-2022 academic year, 13 students graduated with a bachelor's degree in personal & culinary services from SUNY Delhi. About 77% were men and 23% were women.
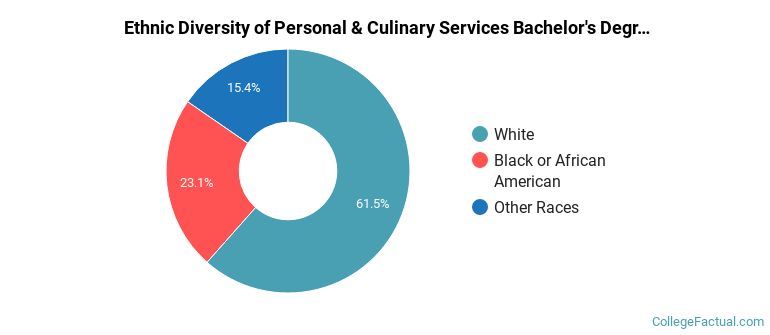
The majority of the students with this major are white. About 62% of 2022 graduates were in this category.
The following table and chart show the ethnic background for students who recently graduated from SUNY Delhi with a bachelor's in personal & culinary services.
| Ethnic Background | Number of Students |
|---|---|
| Asian | 0 |
| Black or African American | 3 |
| Hispanic or Latino | 0 |
| White | 8 |
| Non-Resident Aliens | 0 |
| Other Races | 2 |
SUNY Delhi does not offer an online option for its personal & culinary services bachelor’s degree program at this time. To see if the school offers distance learning options in other areas, visit the SUNY Delhi Online Learning page.
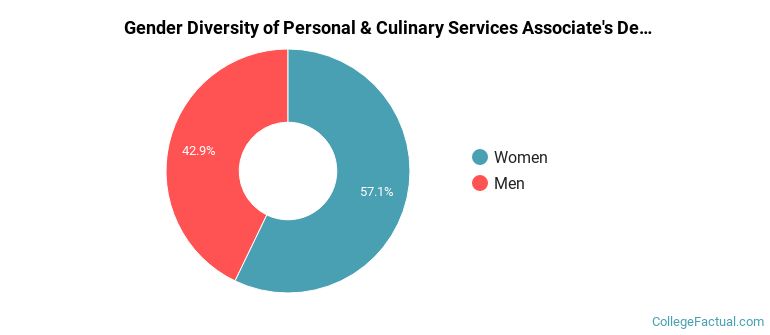
During the 2021-2022 academic year, 7 students graduated with a associate's degree in personal & culinary services from SUNY Delhi. About 43% were men and 57% were women.
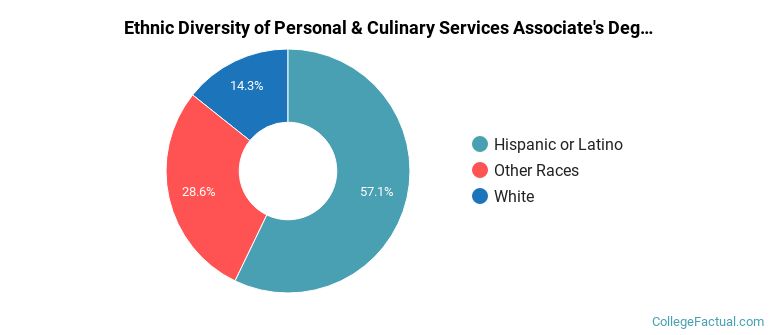
The majority of the associate's degree graduates for this major are Hispanic or Latino. In the most recent graduating class for which data is available, 57% of grads fell into this category.
The following table and chart show the ethnic background for students who recently graduated from SUNY Delhi with a associate's in personal & culinary services.
| Ethnic Background | Number of Students |
|---|---|
| Asian | 0 |
| Black or African American | 0 |
| Hispanic or Latino | 4 |
| White | 1 |
| Non-Resident Aliens | 0 |
| Other Races | 2 |
Take a look at the following statistics related to the make-up of the personal & culinary services majors at SUNY Delhi.
Personal & Culinary Services students may decide to major in one of the following focus areas. Individual majors may not be available for all degree levels.
| Major | Annual Graduates |
|---|---|
| Culinary Arts | 20 |
| Related Major | Annual Graduates |
|---|---|
| Construction Trades | 67 |
| Mechanic & Repair Technologies | 51 |
| Precision Production | 24 |
More about our data sources and methodologies.