Here, you'll find out more about the major, including such details as the number of graduates, what degree levels are offered, ethnicity of students, average salaries, and more. In addition, we cover how SUNY Empire ranks in comparison to other schools with general business programs.
Jump to any of the following sections:
SUNY Empire is in the top 10% of the country for general business. More specifically it was ranked #34 out of 421 schools by College Factual. It is also ranked #2 in New York.
| Ranking Type | Rank |
|---|---|
| Best General Business/Commerce Associate Degree Schools | 13 |
| Best General Business/Commerce Bachelor’s Degree Schools | 23 |
| Best General Business/Commerce Schools | 34 |
During the 2021-2022 academic year, SUNY Empire State College handed out 438 bachelor's degrees in general business/commerce. This is a decrease of 19% over the previous year when 544 degrees were handed out.
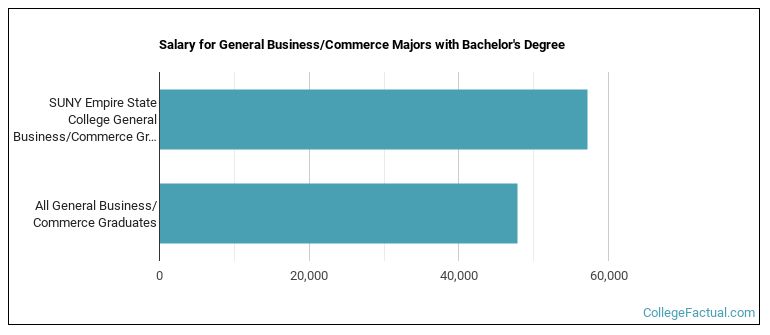
The median salary of general business students who receive their bachelor's degree at SUNY Empire is $57,225. This is higher than $47,842, which is the national median for all general business bachelor's degree recipients.
Out-of-state part-time undergraduates at SUNY Empire paid an average of $708 per credit hour in 2022-2023. The average for in-state students was $295 per credit hour. Information about average full-time undergraduate tuition and fees is shown in the table below.
| In State | Out of State | |
|---|---|---|
| Tuition | $7,070 | $16,980 |
| Fees | $560 | $560 |
| Books and Supplies | $1,528 | $1,528 |
Learn more about SUNY Empire tuition and fees.
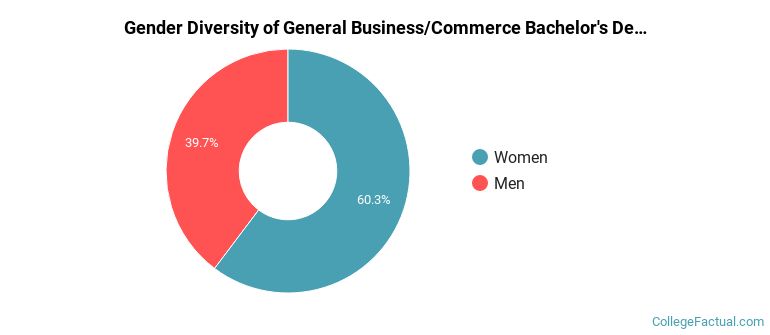
Of the 438 students who graduated with a Bachelor’s in general business from SUNY Empire in 2022, 40% were men and 60% were women.
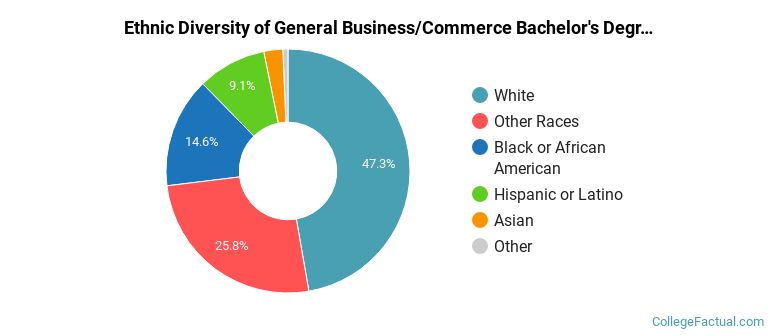
The following table and chart show the ethnic background for students who recently graduated from SUNY Empire State College with a bachelor's in general business.
| Ethnic Background | Number of Students |
|---|---|
| Asian | 11 |
| Black or African American | 64 |
| Hispanic or Latino | 40 |
| White | 207 |
| Non-Resident Aliens | 3 |
| Other Races | 113 |
SUNY Empire does not offer an online option for its general business bachelor’s degree program at this time. To see if the school offers distance learning options in other areas, visit the SUNY Empire Online Learning page.
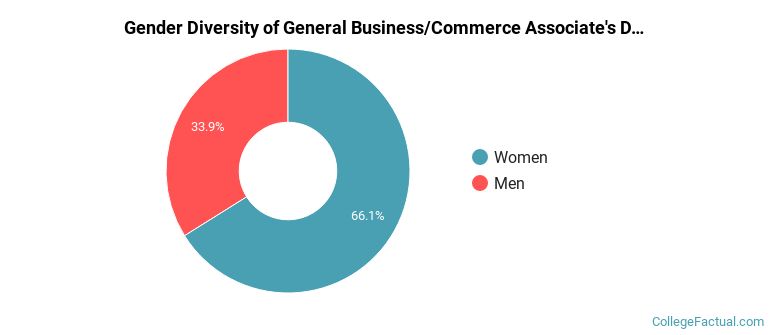
During the 2021-2022 academic year, 59 students graduated with a associate's degree in general business from SUNY Empire. About 34% were men and 66% were women.
The majority of the students with this major are white. About 58% of 2022 graduates were in this category.
The following table and chart show the ethnic background for students who recently graduated from SUNY Empire State College with a associate's in general business.
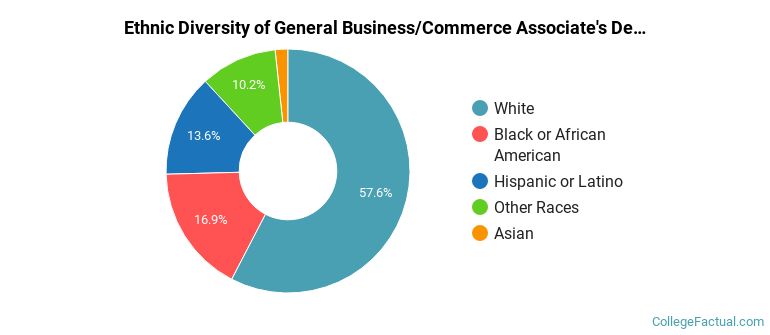
| Ethnic Background | Number of Students |
|---|---|
| Asian | 1 |
| Black or African American | 10 |
| Hispanic or Latino | 8 |
| White | 34 |
| Non-Resident Aliens | 0 |
| Other Races | 6 |
Take a look at the following statistics related to the make-up of the general business majors at SUNY Empire State College.
| Related Major | Annual Graduates |
|---|---|
| Human Resource Management | 285 |
| Business Administration & Management | 228 |
| Accounting | 32 |
| Finance & Financial Management | 25 |
| Marketing | 7 |
More about our data sources and methodologies.