Here, you'll find out more about the major, including such details as the number of graduates, what degree levels are offered, ethnicity of students, average salaries, and more. Also, learn how SUNY Empire ranks among other schools offering degrees in fine arts.
Jump to any of the following sections:
The bachelor's program at SUNY Empire was ranked #287 on College Factual's Best Schools for fine arts list. It is also ranked #35 in New York.
| Ranking Type | Rank |
|---|---|
| Best Fine & Studio Arts Bachelor’s Degree Schools | 278 |
| Best Fine & Studio Arts Schools | 287 |
During the 2021-2022 academic year, SUNY Empire State College handed out 72 bachelor's degrees in fine & studio arts. This is a decrease of 5% over the previous year when 76 degrees were handed out.
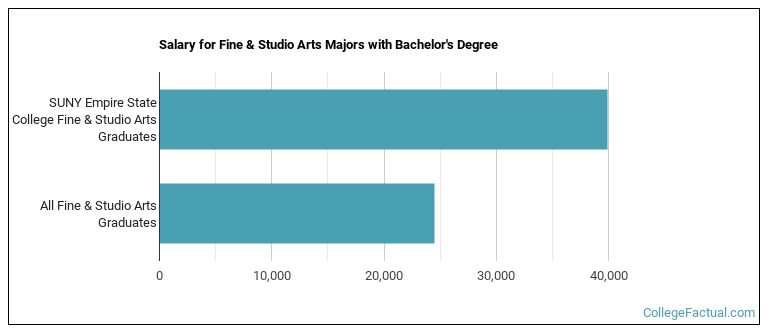
Fine Arts majors who earn their bachelor's degree from SUNY Empire go on to jobs where they make a median salary of $39,946 a year. This is higher than $24,539, which is the national median for all fine arts bachelor's degree recipients.
During the 2022-2023 academic year, part-time undergraduate students at SUNY Empire paid an average of $708 per credit hour if they came to the school from out-of-state. In-state students paid a discounted rate of $295 per credit hour. The following table shows the average full-time tuition and fees for undergraduates.
| In State | Out of State | |
|---|---|---|
| Tuition | $7,070 | $16,980 |
| Fees | $560 | $560 |
| Books and Supplies | $1,528 | $1,528 |
Learn more about SUNY Empire tuition and fees.
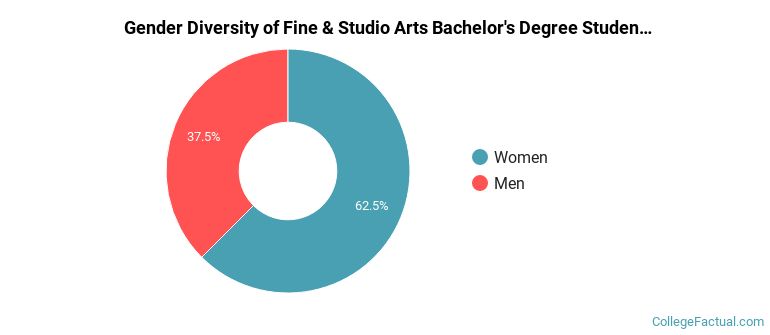
During the 2021-2022 academic year, 72 students graduated with a bachelor's degree in fine arts from SUNY Empire. About 38% were men and 63% were women.
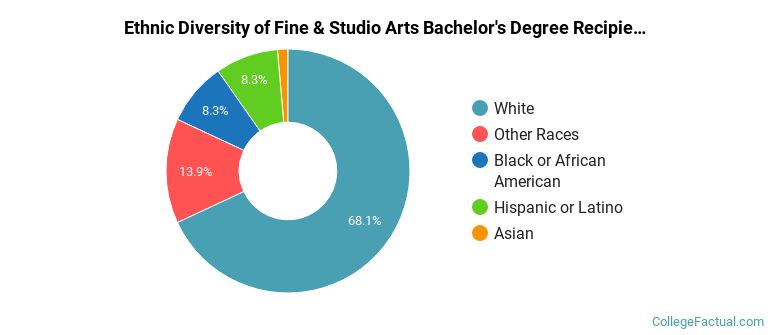
The majority of the students with this major are white. About 68% of 2022 graduates were in this category.
The following table and chart show the ethnic background for students who recently graduated from SUNY Empire State College with a bachelor's in fine arts.
| Ethnic Background | Number of Students |
|---|---|
| Asian | 1 |
| Black or African American | 6 |
| Hispanic or Latino | 6 |
| White | 49 |
| Non-Resident Aliens | 0 |
| Other Races | 10 |
Online degrees for the SUNY Empire fine arts bachelor’s degree program are not available at this time. To see if the school offers distance learning options in other areas, visit the SUNY Empire Online Learning page.
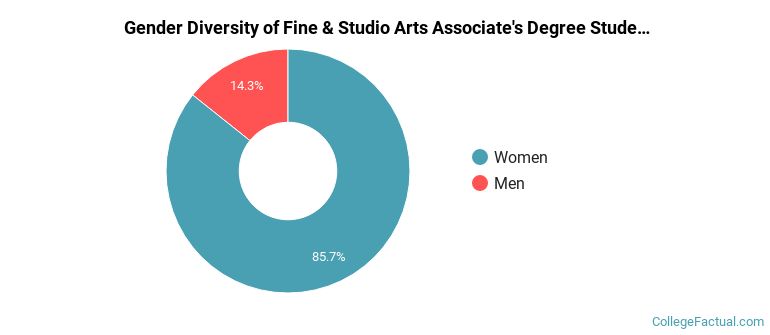
Of the 7 students who earned an associate's degree in Fine & Studio Arts from SUNY Empire in 2021-2022, 14% were men and 86% were women.
The majority of the students with this major are white. About 57% of 2022 graduates were in this category.
The following table and chart show the ethnic background for students who recently graduated from SUNY Empire State College with a associate's in fine arts.
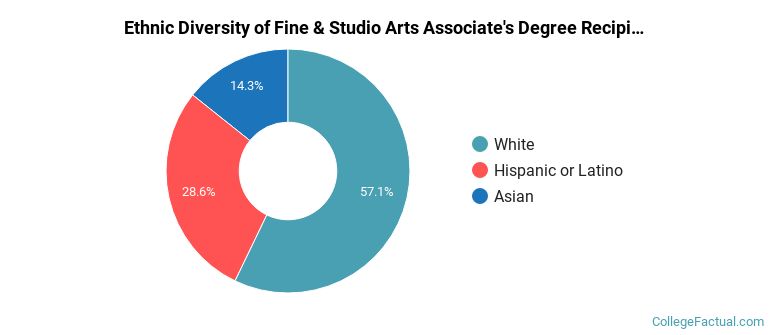
| Ethnic Background | Number of Students |
|---|---|
| Asian | 1 |
| Black or African American | 0 |
| Hispanic or Latino | 2 |
| White | 4 |
| Non-Resident Aliens | 0 |
| Other Races | 0 |
Take a look at the following statistics related to the make-up of the fine arts majors at SUNY Empire State College.
More about our data sources and methodologies.