We've pulled together some essential information you should know about the program, including how many students graduate each year, the ethnic diversity of these students, and more. In addition, we cover how Tennessee Tech University ranks in comparison to other schools with special ed programs.
Go directly to any of the following sections:
The bachelor's program at Tennessee Tech University was ranked #253 on College Factual's Best Schools for special ed list. It is also ranked #6 in Tennessee.
| Ranking Type | Rank |
|---|---|
| Best Special Education Bachelor’s Degree Schools | 164 |
| Best Special Education Schools | 253 |
During the 2021-2022 academic year, Tennessee Technological University handed out 8 bachelor's degrees in special education. This is a decrease of 43% over the previous year when 14 degrees were handed out.
During the 2022-2023 academic year, part-time undergraduate students at Tennessee Tech University paid an average of $783 per credit hour if they came to the school from out-of-state. In-state students paid a discounted rate of $334 per credit hour. Information about average full-time undergraduate tuition and fees is shown in the table below.
| In State | Out of State | |
|---|---|---|
| Tuition | $8,764 | $18,796 |
| Fees | $1,320 | $1,320 |
| Books and Supplies | $1,280 | $1,280 |
| On Campus Room and Board | $10,502 | $10,502 |
| On Campus Other Expenses | $5,400 | $5,400 |
Learn more about Tennessee Tech University tuition and fees.
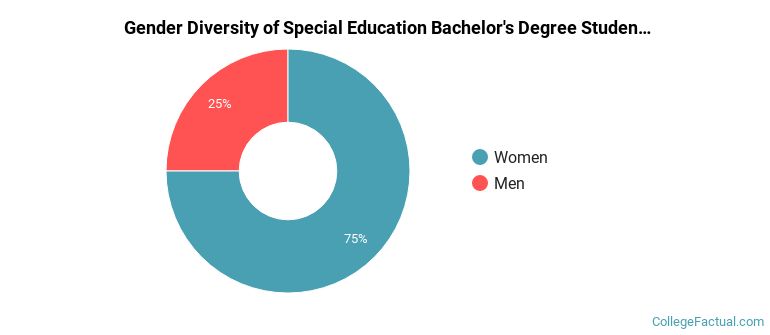
The special ed program at Tennessee Tech University awarded 8 bachelor's degrees in 2021-2022. About 25% of these degrees went to men with the other 75% going to women.
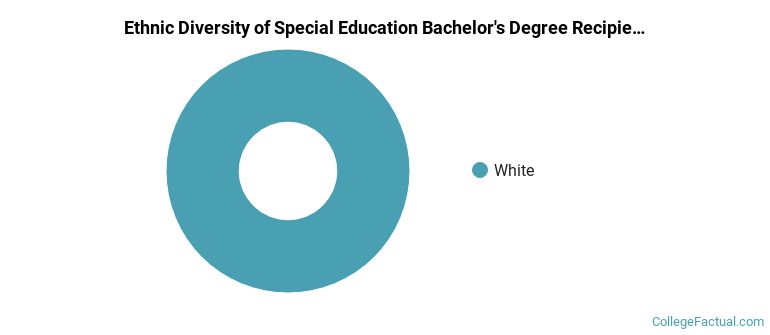
The majority of bachelor's degree recipients in this major at Tennessee Tech University are white. In the most recent graduating class for which data is available, 100% of students fell into this category.
The following table and chart show the ethnic background for students who recently graduated from Tennessee Technological University with a bachelor's in special ed.
| Ethnic Background | Number of Students |
|---|---|
| Asian | 0 |
| Black or African American | 0 |
| Hispanic or Latino | 0 |
| White | 8 |
| Non-Resident Aliens | 0 |
| Other Races | 0 |
Tennessee Tech University does not offer an online option for its special ed bachelor’s degree program at this time. To see if the school offers distance learning options in other areas, visit the Tennessee Tech University Online Learning page.
Take a look at the following statistics related to the make-up of the special ed majors at Tennessee Technological University.
| Related Major | Annual Graduates |
|---|---|
| Teacher Education Grade Specific | 203 |
| Curriculum & Instruction | 112 |
| Student Counseling | 32 |
| Educational Administration | 13 |
More about our data sources and methodologies.