We've pulled together some essential information you should know about the program, including how many students graduate each year, the ethnic diversity of these students, and more. We've also included details on how CCBC ranks compared to other colleges offering a major in cis.
Go directly to any of the following sections:
The bachelor's program at CCBC was ranked #179 on College Factual's Best Schools for cis list.
In 2022-2023, the average part-time undergraduate tuition at CCBC was $372 per credit hour for out-of-state students. The average for in-state students was $241 per credit hour. The average full-time tuition and fees for undergraduates are shown in the table below.
| In State | Out of State | |
|---|---|---|
| Tuition | $5,784 | $8,928 |
| Fees | $1,134 | $1,134 |
| Books and Supplies | $1,430 | $1,430 |
Learn more about CCBC tuition and fees.
CCBC does not offer an online option for its cis bachelor’s degree program at this time. To see if the school offers distance learning options in other areas, visit the CCBC Online Learning page.
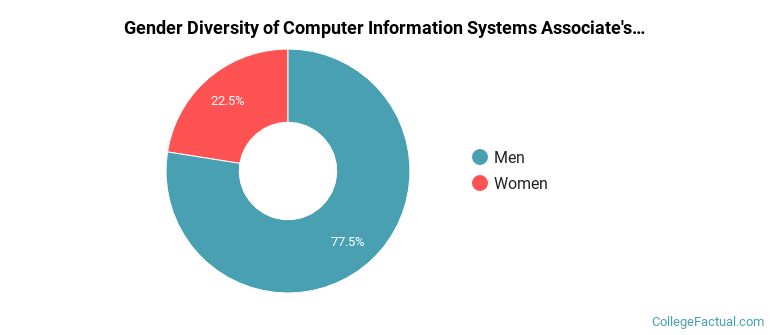
The cis program at CCBC awarded 40 associate's degrees in 2021-2022. About 78% of these degrees went to men with the other 23% going to women.
The following table and chart show the ethnic background for students who recently graduated from Community College of Baltimore County with a associate's in cis.
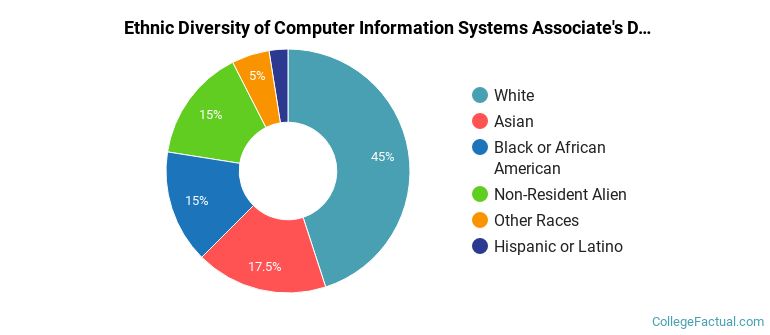
| Ethnic Background | Number of Students |
|---|---|
| Asian | 7 |
| Black or African American | 6 |
| Hispanic or Latino | 1 |
| White | 18 |
| Non-Resident Aliens | 6 |
| Other Races | 2 |
| Related Major | Annual Graduates |
|---|---|
| Information Technology | 62 |
| Computer Systems Networking | 15 |
| Computer Programming | 2 |