We’ve pulled together the essential facts you should know about the program at Tulane University. It is offered at the Bachelor’s level, with graduate study also available. Jump to any of the following sections:
Here is each degree level offered in music at Tulane University, along with how many graduates complete each level annually.
| Degree Level | Annual Graduates |
|---|---|
| Bachelor’s | 16 |
| Master’s | 7 |
During the most recent reporting year, Tulane University of Louisiana awarded 16 bachelor’s degrees in music.
Tulane University is not currently ranked for music at the bachelor’s level.
Information about average full-time undergraduate tuition and fees is shown in the table below.
| In State | Out of State | |
|---|---|---|
| Tuition | $56,684 | $64,372 |
| Fees | $4,306 | $4,306 |
Learn more about Tulane University tuition and fees.
In the most recent graduating class, 62% of music bachelor’s degrees went to men and 38% went to women.
 The largest share of music bachelor’s degree graduates at Tulane University are White. About 62% of graduates fell into this category.
The following table and chart show the ethnic background for students who recently graduated from Tulane University of Louisiana with a bachelor’s in music.
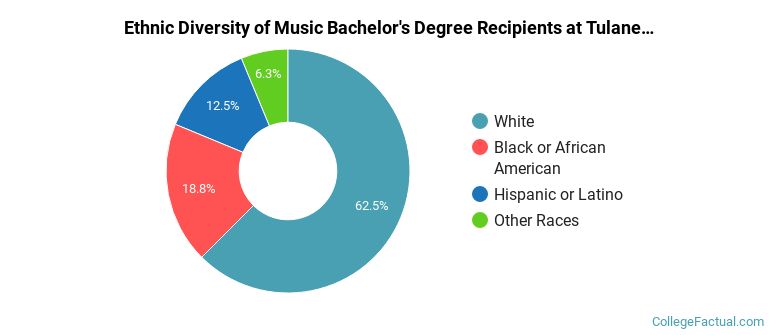
| Ethnic Background | Number of Students |
|---|---|
| Asian | 0 |
| Black or African American | 3 |
| Hispanic or Latino | 2 |
| White | 10 |
| Non-Resident Aliens | 0 |
| Other Races | 1 |
You can also pursue this field at the graduate level at Tulane University. Annual graduate completions by level are shown below.
| Graduate Level | Annual Graduates |
|---|---|
| Master’s Degrees in Music | 7 |