Explore the best ranked schools for the programs you are most interested in.
Union College landed the #1,667 spot in College Factual's 2025 ranking of best overall colleges in the United States. The higher ed experts analyzed 2,152 colleges and universities across the nation to determine this ranking.
Out of the 19 colleges in Nebraska, Union College is ranked at #17.
Because it has a high acceptance rate of 99%, some consider Union College to be a safety school. But don't just assume that admittance is in the bag. Make sure to spend enough time on your application so that it is in tip-top shape.
About 20% of students accepted to Union College submitted their SAT scores. When looking at the 25th through the 75th percentile, SAT Evidence-Based Reading and Writing scores ranged between 510 and 590. Math scores were between 470 and 540.
At Union College, the student to faculty ratio is an excellent 8 to 1. That's much better than the national average of 15 to 1. This indicates that many classes will probably be small, and students will have ample opportunites to work closely with their professors and classmates.
In addition to the student to faculty ratio, some people look at what percentage of faculty members are full-time as a sign of how much time professors will be able to spend with their students. This is because part-time teachers may not be be on campus as much as their full-time counterparts.
The full-time faculty percentage at Union College Nebraska is 96%. This is higher than the national average of 47%.
The freshmen retention rate tells us what percentage of first-year, full-time students choose to continue on to their sophomore year at a particular school. The rate at Union College Nebraska is 68%, which is about average when compared to the national rate of 68%.
The on-time graduation rate is the percent of first-time, full-time students who get their bachelor's degree with four years. At Union College this rate is 32%, which is about average when compared to the national rate of 33.3%.
Find out more about the retention and graduation rates at Union College Nebraska.
During the 2017-2018 academic year, there were 669 undergraduates at Union College with 586 being full-time and 83 being part-time.
| $0-30 K | $30K-48K | $48-75 | $75-110K | $110K + |
|---|---|---|---|---|
| $21,275 | $20,544 | $22,113 | $23,369 | $25,318 |
The net price is calculated by adding tuition, room, board and other costs and subtracting financial aid.Note that the net price is typically less than the published for a school. For more information on the sticker price of Union College, see our tuition and fees and room and board pages.
Almost 66% of college students who graduated with the class of 2018 took out student loans, but that percentage varies from school to school. At Union College, approximately 89% of students took out student loans averaging $4,819 a year. That adds up to $19,276 over four years for those students.
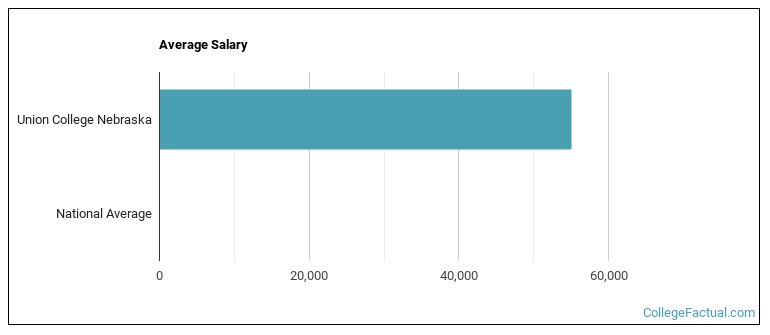
See which majors at Union College Nebraska make the most money.
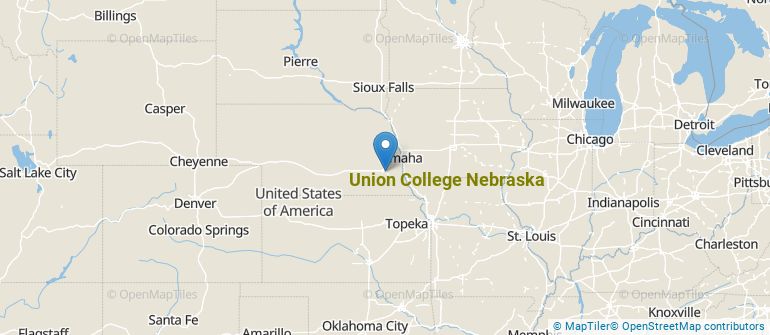
Get more details about the location of Union College Nebraska.
Contact details for Union College are given below.
| Contact Details | |
|---|---|
| Address: | 3800 S 48Th Street, Lincoln, NE 68506 |
| Phone: | 402-486-2600 |
| Website: | https://www.ucollege.edu/ |
| Most Popular Majors | Bachelor’s Degrees | Average Salary of Graduates |
|---|---|---|
| Mathematics | 89 | NA |
| General Biology | 52 | NA |
| Nursing | 37 | $75,244 |
| Allied Health Professions | 32 | NA |
| Business Administration & Management | 30 | $44,045 |
| Computer Information Systems | 12 | NA |
| Allied Health & Medical Assisting Services | 11 | NA |
| Design & Applied Arts | 9 | NA |
| Public Health | 8 | NA |
| Liberal Arts General Studies | 6 | NA |
Online learning options are becoming more and more popular at American colleges and universities. Online classes are great for students who have busy schedules or for those who just want to study on their own time.
In 2022-2023, 16 students took at least one online class at Union College Nebraska. This is a decrease from the 48 students who took online classes the previous year.
| Year | Took at Least One Online Class | Took All Classes Online |
|---|---|---|
| 2022-2023 | 16 | 1 |
| 2021-2022 | 48 | 0 |
| 2020-2021 | 0 | 0 |
| 2018-2019 | 27 | 13 |
Footnotes
*The racial-ethnic minorities count is calculated by taking the total number of students and subtracting white students, international students, and students whose race/ethnicity was unknown. This number is then divided by the total number of students at the school to obtain the racial-ethnic minorities percentage.
References
More about our data sources and methodologies.