Explore the best ranked schools for the programs you are most interested in.
UA Hope-Texarkana was not ranked in College Factual's 2025 Best Overall Colleges report. This could be for a number of reasons, including lack of data.
See all of the rankings for University of Arkansas Hope-Texarkana.
Returning adults and other non-traditional students may appreciate the fact that University of Arkansas Hope-Texarkana has an open admissions policy. This means that you'll only have to submit basic materials, which may include proof that you completed high school or an equivalent program.
The student to faculty ratio is often used to measure the number of teaching resources that a college or university offers its students. The national average for this metric is 15 to 1, but at UA Hope-Texarkana it is much better at 12 to 1. That's good news for students who want to interact more on a personal level with their teachers.
When estimating how much access students will have to their teachers, some people like to look at what percentage of faculty members are full time. This is because part-time teachers may not have as much time to spend on campus as their full-time counterparts.
The full-time faculty percentage at University of Arkansas Hope-Texarkana is 55%. This is higher than the national average of 47%.
The freshmen retention rate tells us what percentage of first-year, full-time students choose to continue on to their sophomore year at a particular school. The rate at University of Arkansas Hope-Texarkana is 67%, which is about average when compared to the national rate of 68%.
During the 2017-2018 academic year, there were 1,211 undergraduates at UA Hope-Texarkana with 506 being full-time and 705 being part-time.
The net price is calculated by adding tuition, room, board and other costs and subtracting financial aid.Note that the net price is typically less than the published for a school. For more information on the sticker price of UA Hope-Texarkana, see our tuition and fees and room and board pages.
While almost two-thirds of students nationwide take out loans to pay for college, the percentage may be quite different for the school you plan on attending. At UA Hope-Texarkana, approximately 1% of students took out student loans averaging $4,000 a year. That adds up to $16,000 over four years for those students.
Get more details about paying for University of Arkansas Hope-Texarkana.
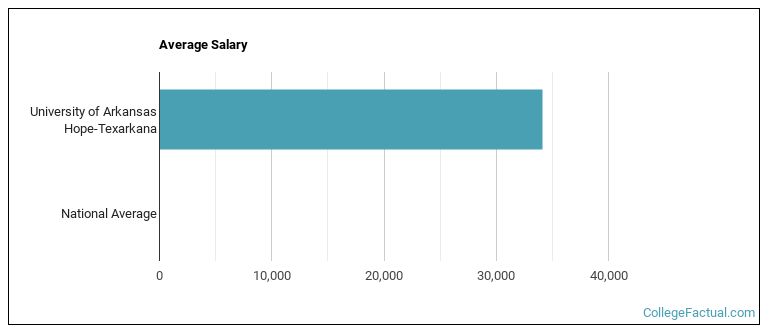
See which majors at University of Arkansas Hope-Texarkana make the most money.
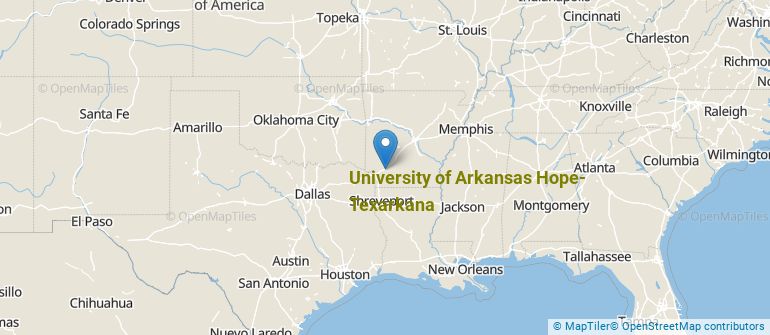
Get more details about the location of University of Arkansas Hope-Texarkana.
Contact details for UA Hope-Texarkana are given below.
| Contact Details | |
|---|---|
| Address: | 2500 S Main, Hope, AR 71801 |
| Phone: | 870-777-5722 |
| Website: | www.uaht.edu/ |
| Most Popular Majors | Bachelor’s Degrees | Average Salary of Graduates |
|---|---|---|
| Liberal Arts General Studies | 228 | NA |
| Practical Nursing & Nursing Assistants | 94 | NA |
| Business Support & Assistant Services | 48 | NA |
| Funeral & Mortuary Science | 47 | NA |
| Vehicle Maintenance & Repair | 35 | NA |
| Nursing | 34 | NA |
| Precision Metal Working | 34 | NA |
| Allied Health & Medical Assisting Services | 24 | NA |
| Electronics Maintenance & Repair | 23 | NA |
| Heating, Air Conditioning, Ventilation & Refrigeration | 20 | NA |
Online courses area a great option for busy, working students as well as for those who have scheduling conflicts and want to study on their own time. As time goes by, expect to see more and more online learning options become available.
In 2022-2023, 859 students took at least one online class at University of Arkansas Hope-Texarkana. This is an increase from the 573 students who took online classes the previous year.
| Year | Took at Least One Online Class | Took All Classes Online |
|---|---|---|
| 2022-2023 | 859 | 310 |
| 2021-2022 | 573 | 298 |
| 2020-2021 | 567 | 261 |
| 2018-2019 | 628 | 216 |
Learn more about online learning at University of Arkansas Hope-Texarkana.
Footnotes
*The racial-ethnic minorities count is calculated by taking the total number of students and subtracting white students, international students, and students whose race/ethnicity was unknown. This number is then divided by the total number of students at the school to obtain the racial-ethnic minorities percentage.
References
More about our data sources and methodologies.