We've pulled together some essential information you should know about the program, including how many students graduate each year, the ethnic diversity of these students, average starting salaries, and more. Also, learn how UC ranks among other schools offering degrees in nursing.
Jump to any of the following sections:
In College Factual's most recent rankings for the best schools for nursing majors, UC came in at #50. This puts it in the top 5% of the country in this field of study. It is also ranked #2 in Ohio.
During the 2021-2022 academic year, University of Cincinnati - Main Campus handed out 379 bachelor's degrees in nursing. Last year, the same number of degrees were handed out.
In 2022, 576 students received their master’s degree in nursing from UC. This makes it the #11 most popular school for nursing master’s degree candidates in the country.
In addition, 69 students received their doctoral degrees in nursing in 2022, making the school the #39 most popular school in the United States for this category of students.
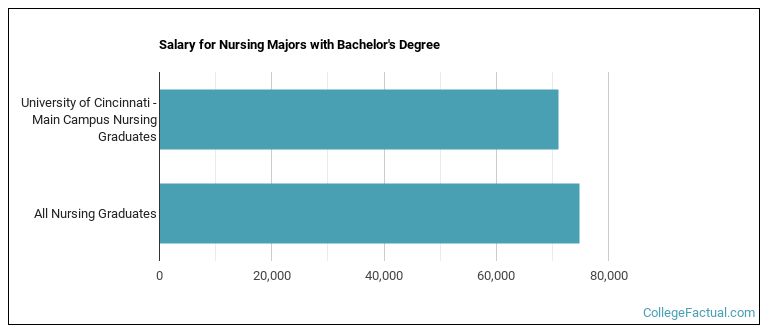
Nursing majors who earn their bachelor's degree from UC go on to jobs where they make a median salary of $71,105 a year. Unfortunately, this is lower than the national average of $74,888 for all nursing students.
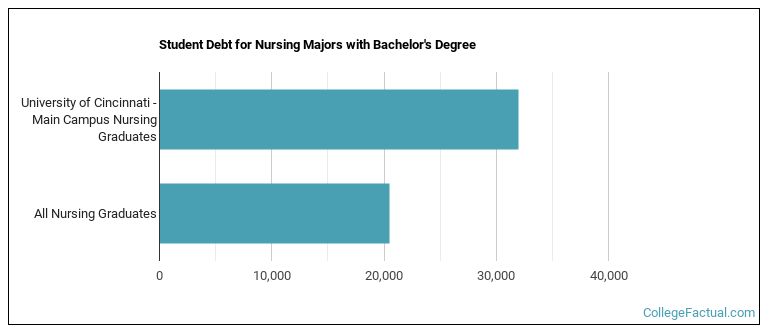
While getting their bachelor's degree at UC, nursing students borrow a median amount of $31,938 in student loans. This is higher than the the typical median of $20,508 for all nursing majors across the country.
The typical student loan payment of a bachelor's degree student from the nursing program at UC is $327 per month.
In 2022-2023, the average part-time undergraduate tuition at UC was $1,107 per credit hour for out-of-state students. The average for in-state students was $468 per credit hour. Information about average full-time undergraduate tuition and fees is shown in the table below.
| In State | Out of State | |
|---|---|---|
| Tuition | $11,228 | $26,562 |
| Fees | $1,678 | $1,678 |
| Books and Supplies | $1,300 | $1,300 |
| On Campus Room and Board | $13,048 | $13,048 |
| On Campus Other Expenses | $5,424 | $5,424 |
Learn more about UC tuition and fees.
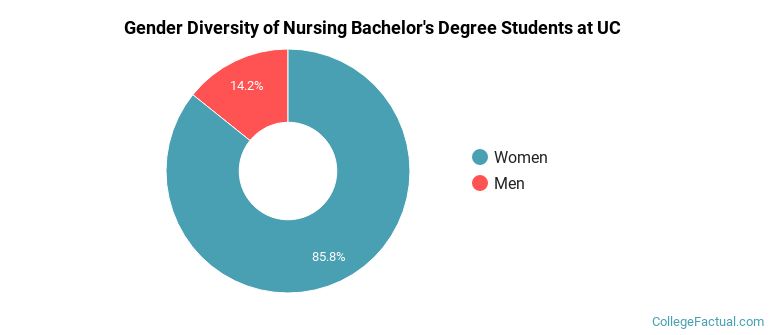
During the 2021-2022 academic year, 379 nursing majors earned their bachelor's degree from UC. Of these graduates, 14% were men and 86% were women.
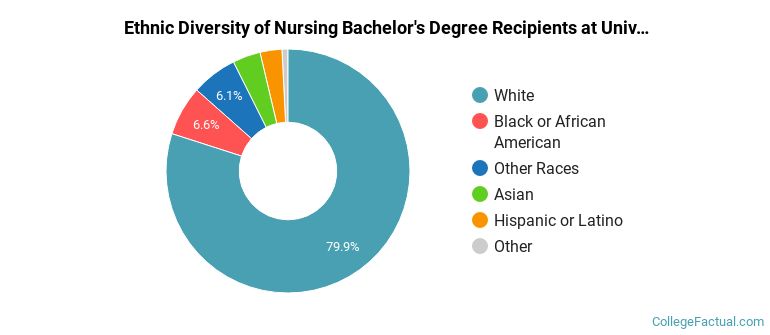
The majority of the students with this major are white. About 80% of 2022 graduates were in this category.
The following table and chart show the ethnic background for students who recently graduated from University of Cincinnati - Main Campus with a bachelor's in nursing.
| Ethnic Background | Number of Students |
|---|---|
| Asian | 14 |
| Black or African American | 25 |
| Hispanic or Latino | 11 |
| White | 303 |
| Non-Resident Aliens | 3 |
| Other Races | 23 |
UC does not offer an online option for its nursing bachelor’s degree program at this time. To see if the school offers distance learning options in other areas, visit the UC Online Learning page.
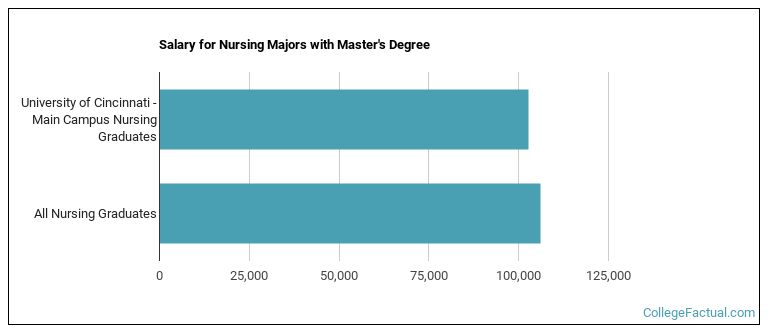
Graduates of the master's nursing program at UC make a median salary of $102,735. This is less than what their typical peers from other schools make. Their median salary is $106,154.
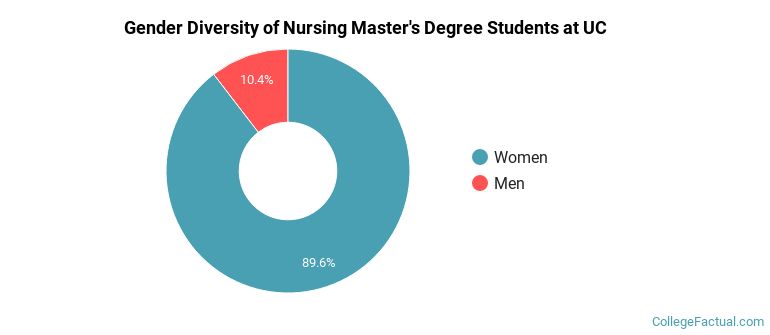
For the most recent academic year available, 10% of nursing master's degrees went to men and 90% went to women.
The majority of master's degree recipients in this major at UC are white. In the most recent graduating class for which data is available, 79% of students fell into this category.
The following table and chart show the ethnic background for students who recently graduated from University of Cincinnati - Main Campus with a master's in nursing.
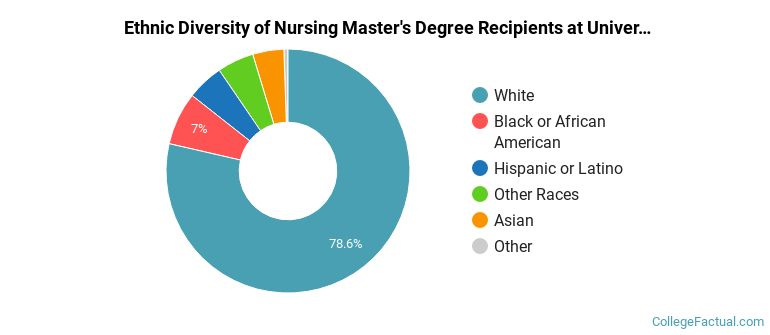
| Ethnic Background | Number of Students |
|---|---|
| Asian | 23 |
| Black or African American | 39 |
| Hispanic or Latino | 27 |
| White | 437 |
| Non-Resident Aliens | 3 |
| Other Races | 27 |
Take a look at the following statistics related to the make-up of the nursing majors at University of Cincinnati - Main Campus.
| Related Major | Annual Graduates |
|---|---|
| Pharmacy/Pharmaceutical Sciences | 191 |
| Communication Sciences | 186 |
| Medicine | 177 |
| Health & Medical Administrative Services | 173 |
| Clinical/Medical Laboratory Science | 158 |
More about our data sources and methodologies.