Here is an overview of this program at University of Cincinnati-Main Campus. Degrees are awarded at the Bachelor’s, Undergraduate Certificate levels, with graduate study also available. It ranks as high as #1 out of 23 schools (Bachelor’s level) by College Factual. Jump to any of the following sections:
College Factual ranks University of Cincinnati-Main Campus highly for criminal justice & corrections, coming in at #107 out of 1,112 schools nationally.
The table below lists every degree level available for criminal justice & corrections at University of Cincinnati-Main Campus, along with how many graduates complete each level annually.Degree Level Annual Graduates Bachelor’s 188 Undergraduate Certificate 29 Master’s 86 Doctoral 19 Graduate Certificate 3
During the most recent reporting year, University of Cincinnati-Main Campus awarded 188 bachelor’s degrees in criminal justice & corrections.
University of Cincinnati-Main Campus is among the very best schools in the country for criminal justice & corrections at the bachelor’s level. Specifically, it ranked #1 out of 23 schools by College Factual.
Criminal Justice & Corrections majors who earn their bachelor’s degree from University of Cincinnati-Main Campus earn a median of $51,329 a year. This is below $66,139, the median for all majors at University of Cincinnati-Main Campus.
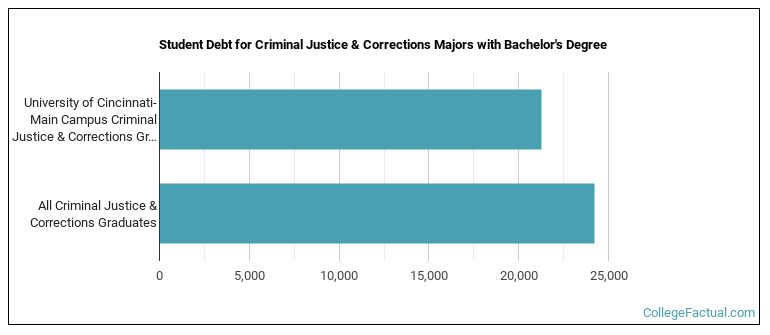
To complete a bachelor’s at University of Cincinnati-Main Campus, criminal justice & corrections graduates take on a median debt of $21,253 in student loans. This is below $24,225, the typical median for all majors at University of Cincinnati-Main Campus.
The full-time undergraduate tuition and fees are shown below.In State Out of State Tuition $10,920 $27,019 Fees $1,678 $1,678
Learn more about University of Cincinnati-Main Campus tuition and fees.
In the most recent graduating class, 32% of criminal justice & corrections bachelor’s degrees went to men and 68% went to women.
 The majority of criminal justice & corrections bachelor’s degree graduates at University of Cincinnati-Main Campus were White. Approximately 76% of graduates fell into this category.
The following table and chart show the ethnic background for students who recently graduated from University of Cincinnati-Main Campus with a bachelor’s in criminal justice & corrections.

| Ethnic Background | Number of Students |
|---|---|
| Asian | 3 |
| Black or African American | 18 |
| Hispanic or Latino | 11 |
| White | 142 |
| Non-Resident Aliens | 0 |
| Other Races | 14 |
University of Cincinnati-Main Campus granted 188 bachelor’s degrees in criminal justice/safety studies in the most recent reporting year — 68% to women and 32% to men. Most of these graduates identified as White (76%).
During the most recent reporting year, University of Cincinnati-Main Campus conferred 29 undergraduate certificate degrees in criminal justice & corrections.
University of Cincinnati-Main Campus is not currently ranked for criminal justice & corrections at the undergraduate certificate level.
For the most recent academic year available, 28% of criminal justice & corrections undergraduate certificate degrees went to men and 72% went to women.
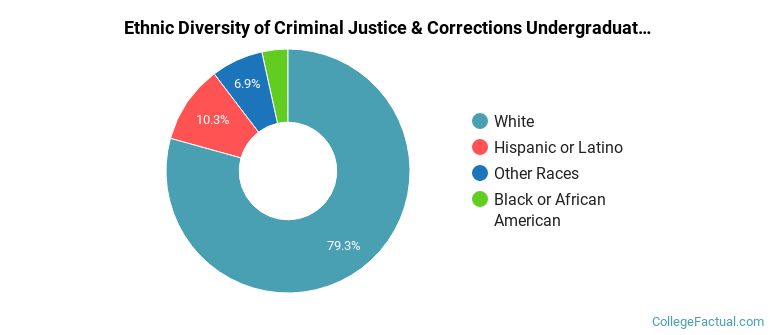
 The largest share of criminal justice & corrections undergraduate certificate degree graduates at University of Cincinnati-Main Campus were White. Roughly 79% of graduates fell into this category.
The following table and chart show the ethnic background for students who recently graduated from University of Cincinnati-Main Campus with a undergraduate certificate in criminal justice & corrections.
| Ethnic Background | Number of Students |
|---|---|
| Asian | 0 |
| Black or African American | 1 |
| Hispanic or Latino | 3 |
| White | 23 |
| Non-Resident Aliens | 0 |
| Other Races | 2 |
University of Cincinnati-Main Campus granted 22 undergraduate certificate completions in corrections and criminal justice, other recently — 77% to women and 23% to men. The most common background among these graduates was White (77%).
University of Cincinnati-Main Campus awarded 7 undergraduate certificate degrees in corrections administration recently — 57% to women and 43% to men. Most of these graduates identified as White (86%).
You can also pursue this field at the graduate level at University of Cincinnati-Main Campus. Annual graduate completions by level are shown below.
