
College Factual analyzes over 2,000 colleges and universities in its annual rankings and ranks them in a variety of ways, including most diverse, best overall quality, best for non-traditional students, and much more.
University of Maryland - Baltimore County was awarded 51 badges in the 2025 rankings. The highest ranked major at the school is multi / interdisciplinary studies.
Explore the best ranked schools for the programs you are most interested in.
College Factual ranked UMBC as #211 out of 2,152 colleges and universities in the country on its 2025 Best Colleges list. This puts it in the top 10% of all schools in the nation.
UMBC is also ranked #6 out of 35 schools in Maryland.
See all of the rankings for University of Maryland - Baltimore County.
University of Maryland - Baltimore County has an acceptance rate of 81%, which makes it somewhat selective. Make sure it's not the only school you apply to, even if it's your school of choice. Whether you get in or not will largely depend on how you compare to other applicants.
About 31% of students accepted to UMBC submitted their SAT scores. When looking at the 25th through the 75th percentile, SAT Evidence-Based Reading and Writing scores ranged between 610 and 690. Math scores were between 600 and 700.
Learn more about University of Maryland - Baltimore County admissions.
The student to faculty ratio is often used to estimate how much interaction there is between professors and their students at a college or university. At University of Maryland - Baltimore County, this ratio is 18 to 1, which is on par with the national average of 15 to 1. That's not bad at all.
Another measure that is often used to estimate how much access students will have to their professors is how many faculty members are full-time. The idea here is that part-time faculty tend to spend less time on campus, so they may not be as available to students as full-timers.
The full-time faculty percentage at University of Maryland - Baltimore County is 64%. This is higher than the national average of 47%.
University of Maryland - Baltimore County has a freshmen retention rate of 86%. That's a good sign that full-time students like the school and their professors enough to want to stick around for another year. It's also a sign that the admissions team did a good job in choosing applicants who were a good fit for the school.
Students are considered to have graduated on time if they finish their studies within four years. At UMBC the on-time graduation rate of first-time, full-time students is 44%. That is great when compared to the national average of 33.3%
Find out more about the retention and graduation rates at University of Maryland - Baltimore County.
During the 2017-2018 academic year, there were 10,932 undergraduates at UMBC with 9,220 being full-time and 1,712 being part-time.
| $0-30 K | $30K-48K | $48-75 | $75-110K | $110K + |
|---|---|---|---|---|
| $10,419 | $14,337 | $20,416 | $25,109 | $26,420 |
The net price is calculated by adding tuition, room, board and other costs and subtracting financial aid.Note that the net price is typically less than the published for a school. For more information on the sticker price of UMBC, see our tuition and fees and room and board pages.
It's not uncommon for college students to take out loans to pay for school. In fact, almost 66% of students nationwide depend at least partially on loans. At UMBC, approximately 28% of students took out student loans averaging $6,654 a year. That adds up to $26,616 over four years for those students.
Get more details about paying for University of Maryland - Baltimore County.
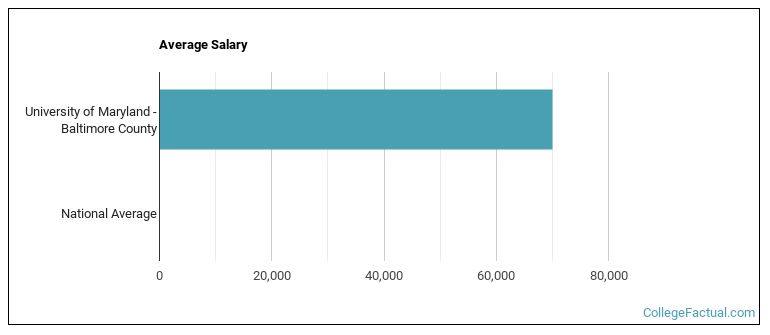
See which majors at University of Maryland - Baltimore County make the most money.
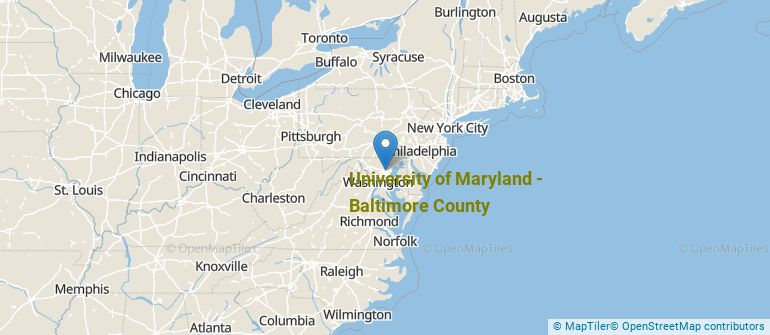
Get more details about the location of University of Maryland - Baltimore County.
Contact details for UMBC are given below.
| Contact Details | |
|---|---|
| Address: | 1000 Hilltop Circle, Baltimore, MD 21250 |
| Phone: | 410-455-1000 |
| Website: | umbc.edu/ |
| Facebook: | https://www.facebook.com/umbcpage |
| Twitter: | http://twitter.com/umbc |
| Most Popular Majors | Bachelor’s Degrees | Average Salary of Graduates |
|---|---|---|
| Information Science | 437 | $63,334 |
| General Psychology | 382 | $35,721 |
| Computer Science | 363 | $83,684 |
| General Biology | 358 | $33,055 |
| Other Multi/Interdisciplinary Studies | 331 | NA |
| Mechanical Engineering | 133 | $71,519 |
| Economics | 114 | $54,859 |
| Social Work | 112 | $40,316 |
| Information Technology | 91 | $46,286 |
| Political Science & Government | 87 | $33,549 |
Online learning is becoming popular at even the oldest colleges and universities in the United States. Not only are online classes great for returning adults with busy schedules, they are also frequented by a growing number of traditional students.
In 2022-2023, 9,444 students took at least one online class at University of Maryland - Baltimore County. This is a decrease from the 10,586 students who took online classes the previous year.
| Year | Took at Least One Online Class | Took All Classes Online |
|---|---|---|
| 2022-2023 | 9,444 | 969 |
| 2021-2022 | 10,586 | 1,968 |
| 2020-2021 | 13,407 | 11,233 |
| 2018-2019 | 1,234 | 412 |
Learn more about online learning at University of Maryland - Baltimore County.
If you’re considering University of Maryland - Baltimore County, here are some more schools you may be interested in knowing more about.
Curious on how these schools stack up against UMBC? Pit them head to head with College Combat, our free interactive tool that lets you compare college on the features that matter most to you!
Footnotes
*The racial-ethnic minorities count is calculated by taking the total number of students and subtracting white students, international students, and students whose race/ethnicity was unknown. This number is then divided by the total number of students at the school to obtain the racial-ethnic minorities percentage.
References
More about our data sources and methodologies.