We've pulled together some essential information you should know about the program, including how many students graduate each year, the ethnic diversity of these students, and more. We've also included details on how UNL ranks compared to other colleges offering a major in food science tech.
Go directly to any of the following sections:
The bachelor's program at UNL was ranked #13 on College Factual's Best Schools for food science tech list. It is also ranked #1 in Nebraska.
During the 2021-2022 academic year, University of Nebraska - Lincoln handed out 25 bachelor's degrees in food science technology. This is a decrease of 68% over the previous year when 77 degrees were handed out.
In 2022, 7 students received their master’s degree in food science tech from UNL. This makes it the #20 most popular school for food science tech master’s degree candidates in the country.
In addition, 13 students received their doctoral degrees in food science tech in 2022, making the school the #1 most popular school in the United States for this category of students.
Out-of-state part-time undergraduates at UNL paid an average of $859 per credit hour in 2022-2023. The average for in-state students was $268 per credit hour. Information about average full-time undergraduate tuition and fees is shown in the table below.
| In State | Out of State | |
|---|---|---|
| Tuition | $8,010 | $25,650 |
| Fees | $2,098 | $2,098 |
| Books and Supplies | $1,250 | $1,250 |
| On Campus Room and Board | $13,856 | $13,856 |
| On Campus Other Expenses | $3,442 | $3,442 |
Learn more about UNL tuition and fees.
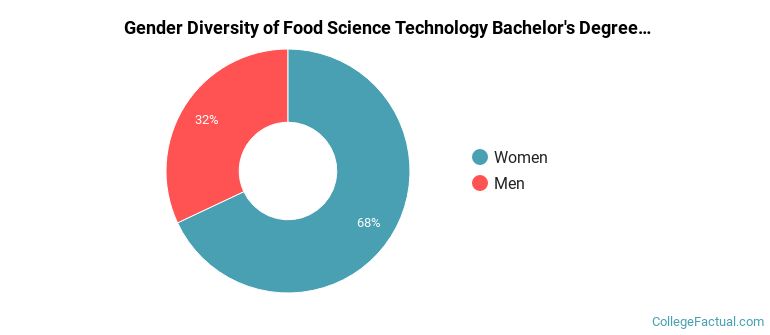
Of the 25 students who graduated with a Bachelor’s in food science tech from UNL in 2022, 32% were men and 68% were women.
The following table and chart show the ethnic background for students who recently graduated from University of Nebraska - Lincoln with a bachelor's in food science tech.
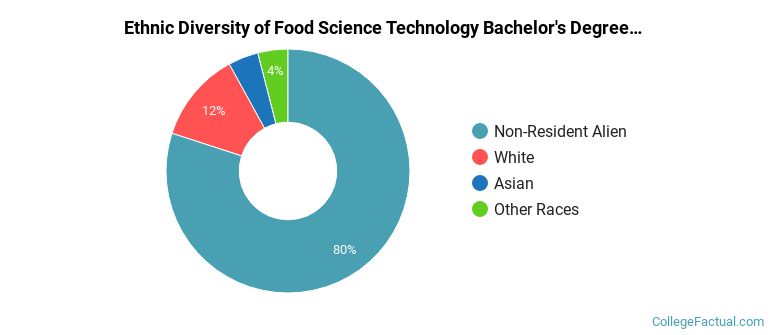
| Ethnic Background | Number of Students |
|---|---|
| Asian | 1 |
| Black or African American | 0 |
| Hispanic or Latino | 0 |
| White | 3 |
| Non-Resident Aliens | 20 |
| Other Races | 1 |
Online degrees for the UNL food science tech bachelor’s degree program are not available at this time. To see if the school offers distance learning options in other areas, visit the UNL Online Learning page.
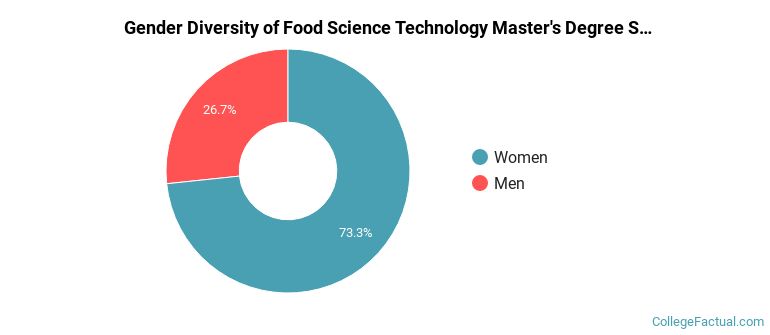
The food science tech program at UNL awarded 15 master's degrees in 2021-2022. About 27% of these degrees went to men with the other 73% going to women.
The following table and chart show the ethnic background for students who recently graduated from University of Nebraska - Lincoln with a master's in food science tech.
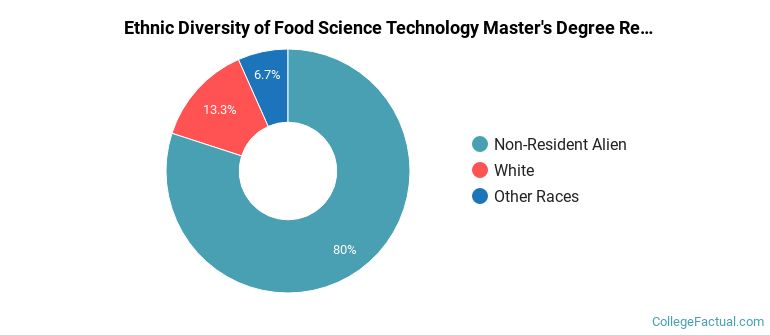
| Ethnic Background | Number of Students |
|---|---|
| Asian | 0 |
| Black or African American | 0 |
| Hispanic or Latino | 0 |
| White | 2 |
| Non-Resident Aliens | 12 |
| Other Races | 1 |
Take a look at the following statistics related to the make-up of the food science tech majors at University of Nebraska - Lincoln.
| Related Major | Annual Graduates |
|---|---|
| Animal Science | 121 |
| Agricultural Economics & Business | 102 |
| Plant Sciences | 95 |
| Other Agriculture | 81 |
| General Agriculture | 40 |
More about our data sources and methodologies.