In its yearly rankings, College Factual analyzes over 2,000 colleges and universities to determine which ones are the best in a variety of categories, such as overall value, quality, diversity, which schools are the best for each major, and much more.
University of Puget Sound was awarded 1 badge in the 2025 rankings. The highest ranked major at the school is political science & government.
Explore the best ranked schools for the programs you are most interested in.
Puget Sound is ranked #875 out of 2,152 schools in the nation for overall quality on College Factual's 2025 Best Colleges list.
Out of the 50 colleges in Washington, Puget Sound is ranked at #14.
When it comes to admittance, University of Puget Sound is somewhat selective. Its acceptance rate is 83%, which means you'll face some strong competition during the admissions process. Do what you can to make your application stand out.
About 28% of students accepted to Puget Sound submitted their SAT scores. When looking at the 25th through the 75th percentile, SAT Evidence-Based Reading and Writing scores ranged between 600 and 700. Math scores were between 570 and 690.
At Puget Sound, the student to faculty ratio is an excellent 9 to 1. That's much better than the national average of 15 to 1. This indicates that many classes will probably be small, and students will have ample opportunites to work closely with their professors and classmates.
When estimating how much access students will have to their teachers, some people like to look at what percentage of faculty members are full time. This is because part-time teachers may not have as much time to spend on campus as their full-time counterparts.
The full-time faculty percentage at University of Puget Sound is 77%. This is higher than the national average of 47%.
University of Puget Sound has a freshmen retention rate of 79%. That's a good sign that full-time students like the school and their professors enough to want to stick around for another year. It's also a sign that the admissions team did a good job in choosing applicants who were a good fit for the school.
The on-time graduation rate for someone pursuing a bachelor's degree is typically four years. This rate at Puget Sound for first-time, full-time students is 68%, which is better than the national average of 33.3%.
Find out more about the retention and graduation rates at University of Puget Sound.
During the 2017-2018 academic year, there were 1,898 undergraduates at Puget Sound with 1,830 being full-time and 68 being part-time.
| $0-30 K | $30K-48K | $48-75 | $75-110K | $110K + |
|---|---|---|---|---|
| $26,537 | $27,810 | $36,006 | $34,060 | $45,126 |
The net price is calculated by adding tuition, room, board and other costs and subtracting financial aid.Note that the net price is typically less than the published for a school. For more information on the sticker price of Puget Sound, see our tuition and fees and room and board pages.
While almost two-thirds of students nationwide take out loans to pay for college, the percentage may be quite different for the school you plan on attending. At Puget Sound, approximately 50% of students took out student loans averaging $7,519 a year. That adds up to $30,076 over four years for those students.
Get more details about paying for University of Puget Sound.
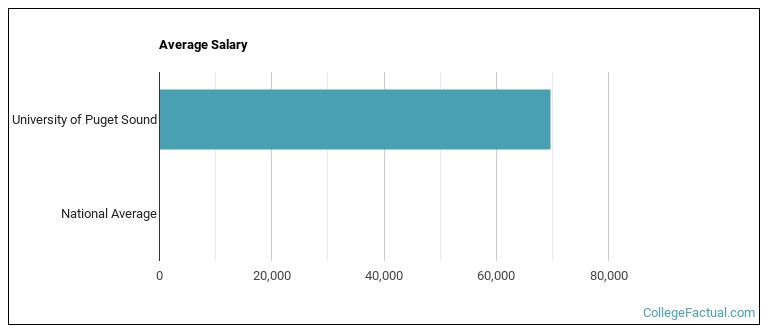
See which majors at University of Puget Sound make the most money.
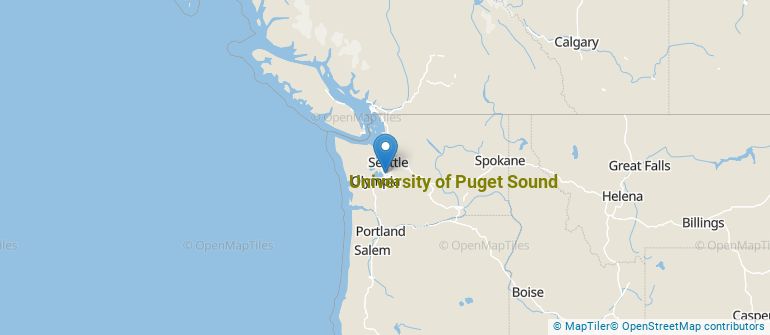
Get more details about the location of University of Puget Sound.
Contact details for Puget Sound are given below.
| Contact Details | |
|---|---|
| Address: | 1500 N. Warner Street, Tacoma, WA 98416 |
| Phone: | 253-879-3100 |
| Website: | www.pugetsound.edu/ |
| Most Popular Majors | Bachelor’s Degrees | Average Salary of Graduates |
|---|---|---|
| Rehabilitation & Therapeutic Professions | 80 | NA |
| Business Administration & Management | 62 | $49,106 |
| Political Science & Government | 53 | $31,290 |
| General Psychology | 41 | $25,596 |
| General Education | 33 | $20,039 |
| Communication & Media Studies | 29 | $29,477 |
| Computer Science | 26 | $66,055 |
| Economics | 26 | $48,153 |
| Health & Physical Education | 25 | $22,260 |
| General Biology | 19 | $30,191 |
If you’re considering University of Puget Sound, here are some more schools you may be interested in knowing more about.
Curious on how these schools stack up against Puget Sound? Pit them head to head with College Combat, our free interactive tool that lets you compare college on the features that matter most to you!
Footnotes
*The racial-ethnic minorities count is calculated by taking the total number of students and subtracting white students, international students, and students whose race/ethnicity was unknown. This number is then divided by the total number of students at the school to obtain the racial-ethnic minorities percentage.
References
More about our data sources and methodologies.