We’ve pulled together the essential facts you should know about the program at UR/U of Richmond/Richmond. It is offered at the Bachelor’s level. It ranks as high as #6 out of 21 schools (Bachelor’s level) by College Factual. Jump to any of the following sections:
College Factual ranks UR/U of Richmond/Richmond among the top schools in the country for political science & government, placing at #92 out of 679 schools nationally.
| Ranking | Rank |
|---|---|
| Best Political Science & Government Schools | 92 of 679 |
| Best Political Science & Government Schools in Virginia | 6 of 22 |
| Best Political Science & Government Schools in the Southeast Region | 16 of 151 |
Here is each degree level granted in political science & government at UR/U of Richmond/Richmond, along with how many graduates complete each level annually.
| Degree Level | Annual Graduates |
|---|---|
| Bachelor’s | 33 |
In the most recent year for which we have data, University of Richmond conferred 33 bachelor’s degrees in political science & government.
UR/U of Richmond/Richmond is a solid choice among schools offering political science & government at the bachelor’s level. Its best result was #6 out of 21 schools by College Factual.
Political Science & Government graduates with a bachelor’s degree from UR/U of Richmond/Richmond earn a median of $58,382 a year. This is lower than $80,851, the median for all majors at UR/U of Richmond/Richmond.
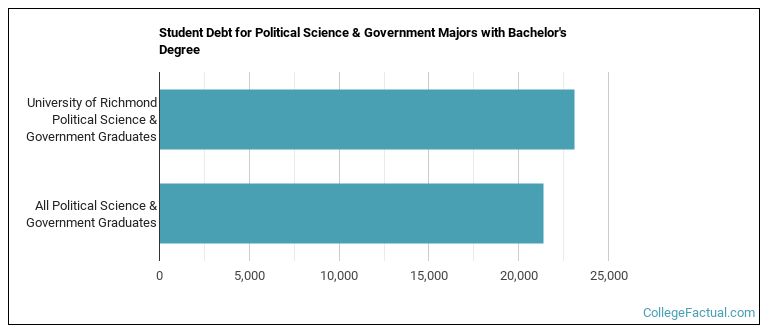
While getting their bachelor’s degree at UR/U of Richmond/Richmond, political science & government students accumulate a median of $23,080 in student loans. This is higher than $21,358, the typical median for all majors at UR/U of Richmond/Richmond.
Average full-time tuition and fees are listed in the table below.
| In State | Out of State | |
|---|---|---|
| Tuition | $58,570 | $65,230 |
Find out more about UR/U of Richmond/Richmond tuition and fees.
In the most recent graduating class, 39% of political science & government bachelor’s degrees went to men and 61% went to women.
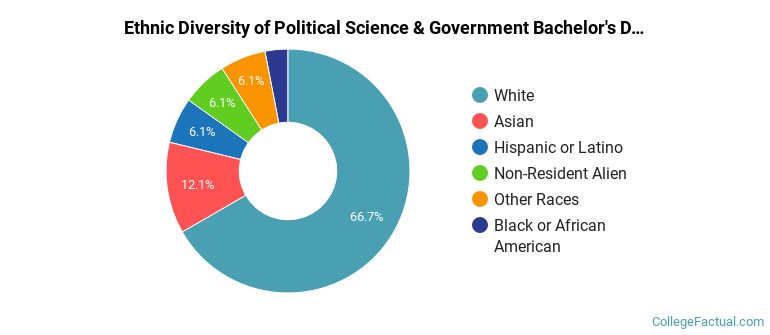
 The largest share of political science & government bachelor’s degree graduates at UR/U of Richmond/Richmond are White. Approximately 67% of graduates fell into this category.
The following table and chart show the ethnic background for students who recently graduated from University of Richmond with a bachelor’s in political science & government.
| Ethnic Background | Number of Students |
|---|---|
| Asian | 4 |
| Black or African American | 1 |
| Hispanic or Latino | 2 |
| White | 22 |
| Non-Resident Aliens | 2 |
| Other Races | 2 |
UR/U of Richmond/Richmond awarded 33 bachelor’s degrees in political science and government, general in the most recent reporting year — 61% to women and 39% to men. The most common background among these graduates was White (67%).
