Jump to any of the following sections:
UofSC is in the top 10% of the country for visual & performing arts. More specifically it was ranked #65 out of 641 schools by College Factual. It is also ranked #1 in South Carolina.
During the 2021-2022 academic year, University of South Carolina - Columbia handed out 222 bachelor's degrees in visual & performing arts. This is a decrease of 14% over the previous year when 259 degrees were handed out.
In 2022, 36 students received their master’s degree in visual & performing arts from UofSC. This makes it the #122 most popular school for visual & performing arts master’s degree candidates in the country.
In addition, 15 students received their doctoral degrees in visual & performing arts in 2022, making the school the #41 most popular school in the United States for this category of students.
During the 2022-2023 academic year, part-time undergraduate students at UofSC paid an average of $1,439 per credit hour if they came to the school from out-of-state. In-state students paid a discounted rate of $512 per credit hour. Information about average full-time undergraduate tuition and fees is shown in the table below.
| In State | Out of State | |
|---|---|---|
| Tuition | $12,288 | $34,543 |
| Fees | $400 | $400 |
| Books and Supplies | $1,226 | $1,226 |
| On Campus Room and Board | $12,558 | $12,558 |
| On Campus Other Expenses | $5,505 | $5,505 |
Learn more about UofSC tuition and fees.
For the most recent academic year available, 46% of visual & performing arts bachelor's degrees went to men and 54% went to women.

The majority of bachelor's degree recipients in this major at UofSC are white. In the most recent graduating class for which data is available, 63% of students fell into this category.
The following table and chart show the ethnic background for students who recently graduated from University of South Carolina - Columbia with a bachelor's in visual & performing arts.
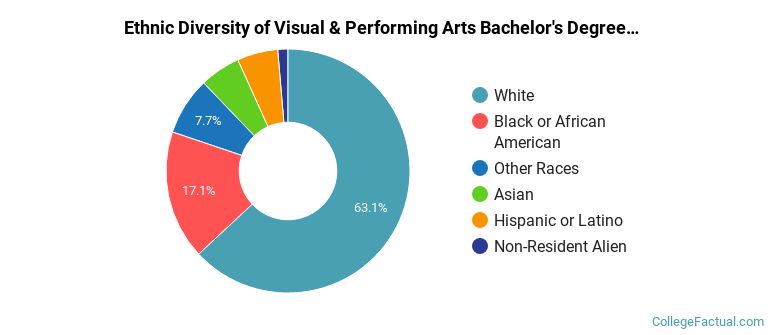
| Ethnic Background | Number of Students |
|---|---|
| Asian | 12 |
| Black or African American | 38 |
| Hispanic or Latino | 12 |
| White | 140 |
| Non-Resident Aliens | 3 |
| Other Races | 17 |
UofSC does not offer an online option for its visual & performing arts bachelor’s degree program at this time. To see if the school offers distance learning options in other areas, visit the UofSC Online Learning page.
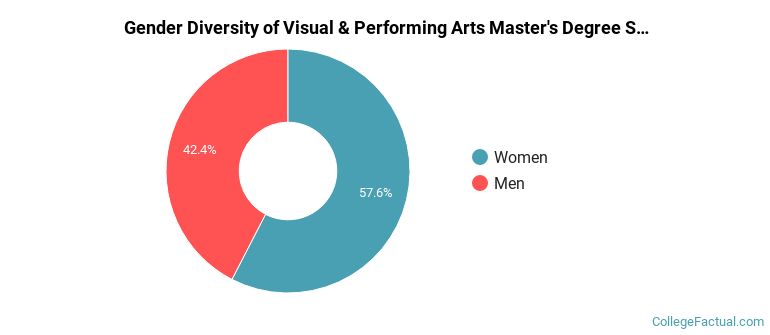
The visual & performing arts program at UofSC awarded 33 master's degrees in 2021-2022. About 42% of these degrees went to men with the other 58% going to women.
The majority of master's degree recipients in this major at UofSC are white. In the most recent graduating class for which data is available, 64% of students fell into this category.
The following table and chart show the ethnic background for students who recently graduated from University of South Carolina - Columbia with a master's in visual & performing arts.
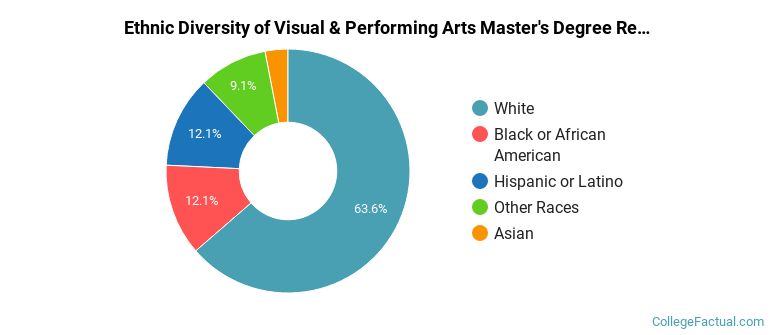
| Ethnic Background | Number of Students |
|---|---|
| Asian | 1 |
| Black or African American | 4 |
| Hispanic or Latino | 4 |
| White | 21 |
| Non-Resident Aliens | 0 |
| Other Races | 3 |
Take a look at the following statistics related to the make-up of the visual & performing arts majors at University of South Carolina - Columbia.
Visual & Performing Arts students may decide to major in one of the following focus areas. Individual majors may not be available for all degree levels.
| Major | Annual Graduates |
|---|---|
| Film, Video & Photographic Arts | 105 |
| Music | 102 |
| Fine & Studio Arts | 48 |
| Dance | 15 |
| Drama & Theater Arts | 15 |
More about our data sources and methodologies.