We’ve pulled together the essential facts you should know about the program at The U. It is offered at the Bachelor’s level, with graduate study also available. At its best it places at #1 out of 3 schools (Bachelor’s level) by College Factual. Jump to any of the following sections:
By College Factual’s measure, The U highly for dance, ranked #14 out of 96 schools nationally.
| Ranking | Rank |
|---|---|
| Best Dance Schools | 14 of 96 |
| Best Dance Schools in Utah | 1 of 3 |
| Best Dance Schools in the Rocky Mountains Region | 1 of 4 |
The table below lists every degree level offered in dance at The U, along with how many graduates complete each level annually.
| Degree Level | Annual Graduates |
|---|---|
| Bachelor’s | 37 |
| Master’s | 8 |
| Graduate Certificate | 1 |
In the most recent year for which we have data, University of Utah conferred 37 bachelor’s degrees in dance.
The U is among the very best schools in the country for dance at the bachelor’s level. Its best result was #1 out of 3 schools by College Factual.
| Ranking | Rank |
|---|---|
| Best Dance Bachelor’s Degree Schools in the Rocky Mountains Region | 1 |
| Best Dance Bachelor’s Degree Schools in Utah | 1 |
| Best Dance Bachelor’s Degree Schools | 13 |
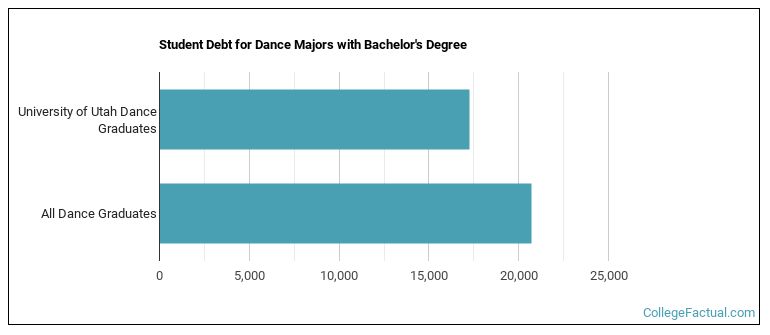
To complete a bachelor’s at The U, dance students borrow a median amount of $17,269 in student loans. This is below $20,739, the typical median for all majors at The U.
Average full-time tuition and fees are listed in the table below.
| In State | Out of State | |
|---|---|---|
| Tuition | $7,749 | $29,701 |
| Fees | $1,159 | $1,159 |
Read more about The U tuition and fees.
For the most recent academic year available, 8% of dance bachelor’s degrees went to men and 92% went to women.
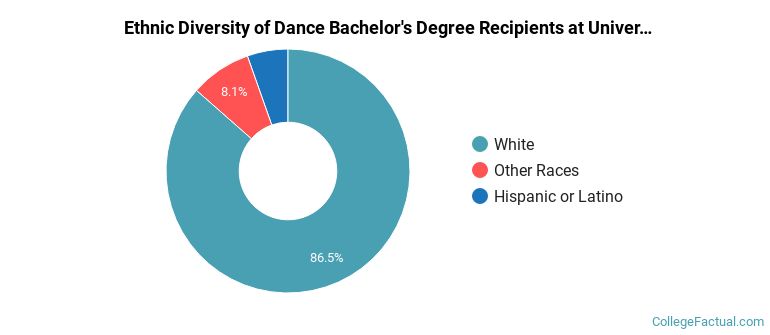
 The majority of dance bachelor’s degree graduates at The U are White. Approximately 86% of graduates fell into this category.
The following table and chart show the ethnic background for students who recently graduated from University of Utah with a bachelor’s in dance.
| Ethnic Background | Number of Students |
|---|---|
| Asian | 0 |
| Black or African American | 0 |
| Hispanic or Latino | 2 |
| White | 32 |
| Non-Resident Aliens | 0 |
| Other Races | 3 |
The U awarded 26 bachelor’s degrees in ballet in the latest year of data — 88% to women and 12% to men. The largest share of these graduates were White (85%).
You can also pursue this field at the graduate level at The U. Annual graduate completions by level are shown below.
| Graduate Level | Annual Graduates |
|---|---|
| Master’s Degrees in Dance | 8 |
| Graduate Certificate Degrees in Dance | 1 |