Here is an overview of this program at Virginia Tech. You can study it at the Bachelor’s level, with graduate study also available. At its best it places at #2 out of 7 schools (Bachelor’s level) by College Factual. Jump to any of the following sections:
By College Factual’s measure, Virginia Tech highly for finance & financial management, coming in at #32 out of 539 schools nationally.
| Ranking | Rank |
|---|---|
| Best Finance & Financial Management Schools | 32 of 539 |
| Best Finance & Financial Management Schools in Virginia | 2 of 10 |
| Best Finance & Financial Management Schools in the Southeast Region | 8 of 121 |
The following degree levels are granted in finance & financial management at Virginia Tech, along with how many graduates complete each level annually.
| Degree Level | Annual Graduates |
|---|---|
| Bachelor’s | 330 |
| Graduate Certificate | 1 |
In the most recent year for which we have data, Virginia Polytechnic Institute and State University conferred 330 bachelor’s degrees in finance & financial management.
Virginia Tech is among the very best schools in the country for finance & financial management at the bachelor’s level. Specifically, it ranked #2 out of 7 schools by College Factual.
Finance & Financial Management students who finish a bachelor’s at Virginia Tech earn a median of $85,837 a year. This is above $77,896, the median for all majors at Virginia Tech.
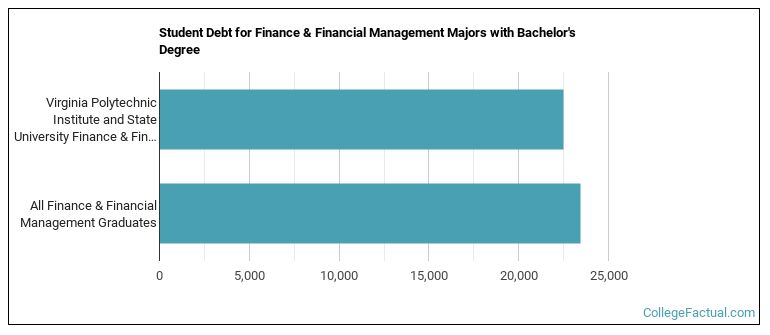
While getting their bachelor’s degree at Virginia Tech, finance & financial management students borrow a median amount of $22,500 in student loans. This is lower than $23,442, the typical median for all majors at Virginia Tech.
Average full-time tuition and fees are listed in the table below.
| In State | Out of State | |
|---|---|---|
| Tuition | $11,420 | $34,362 |
| Fees | $2,796 | $3,402 |
Learn more about Virginia Tech tuition and fees.
Among recent graduates, 76% of finance & financial management bachelor’s degrees went to men and 24% went to women.
 The largest share of finance & financial management bachelor’s degree graduates at Virginia Tech are White. About 67% of graduates fell into this category.
The following table and chart show the ethnic background for students who recently graduated from Virginia Polytechnic Institute and State University with a bachelor’s in finance & financial management.
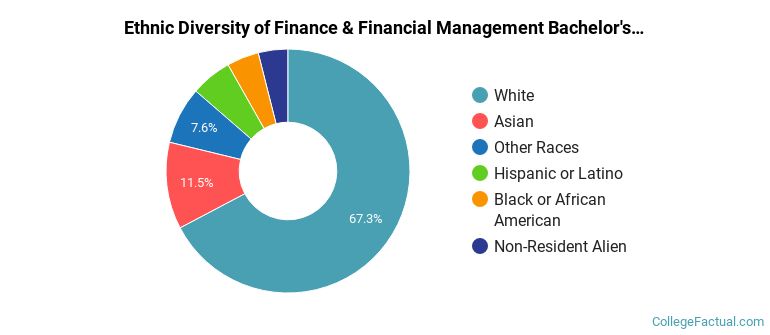
| Ethnic Background | Number of Students |
|---|---|
| Asian | 38 |
| Black or African American | 14 |
| Hispanic or Latino | 18 |
| White | 222 |
| Non-Resident Aliens | 13 |
| Other Races | 25 |
Virginia Tech awarded 330 bachelor’s completions in finance, general recently — 24% to women and 76% to men. The largest share of these graduates were White (67%).
You can also pursue this field at the graduate level at Virginia Tech. The following graduate award levels are reported.
| Graduate Level | Annual Graduates |
|---|---|
| Graduate Certificate Degrees in Finance & Financial Management | 1 |
