Jump to any of the following sections:
WGU is in the top 10% of the country for education. More specifically it was ranked #42 out of 798 schools by College Factual. It is also ranked #1 in Utah.
During the 2021-2022 academic year, Western Governors University handed out 4669 bachelor's degrees in education. This is a decrease of 44% over the previous year when 8,356 degrees were handed out.
In 2022, 8,188 students received their master’s degree in education from WGU. This makes it the #1 most popular school for education master’s degree candidates in the country.
The following table shows the average full-time tuition and fees for undergraduates.
| In State | Out of State | |
|---|---|---|
| Tuition | $7,710 | $7,710 |
| Fees | $590 | $590 |
| Books and Supplies | $200 | $200 |
Learn more about WGU tuition and fees.
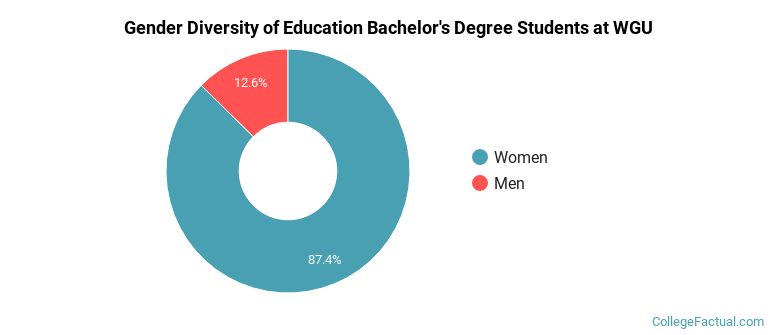
The education program at WGU awarded 4,669 bachelor's degrees in 2021-2022. About 13% of these degrees went to men with the other 87% going to women.
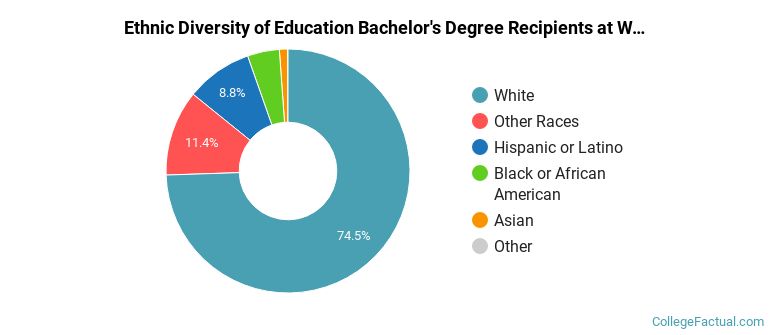
The majority of bachelor's degree recipients in this major at WGU are white. In the most recent graduating class for which data is available, 74% of students fell into this category.
The following table and chart show the ethnic background for students who recently graduated from Western Governors University with a bachelor's in education.
| Ethnic Background | Number of Students |
|---|---|
| Asian | 51 |
| Black or African American | 198 |
| Hispanic or Latino | 411 |
| White | 3,477 |
| Non-Resident Aliens | 2 |
| Other Races | 530 |
If you’re interested in online learning, you’re in luck. WGU does offer online classes in its education bachelor’s degree program. To see if the school offers distance learning options in other areas, visit the WGU Online Learning page.
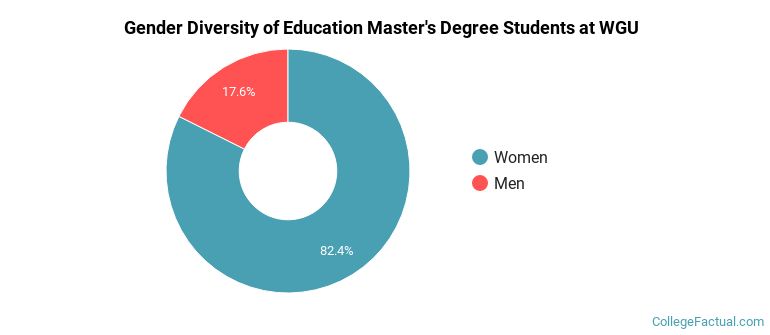
Of the 7,722 students who earned a master's degree in Education from WGU in 2021-2022, 18% were men and 82% were women.
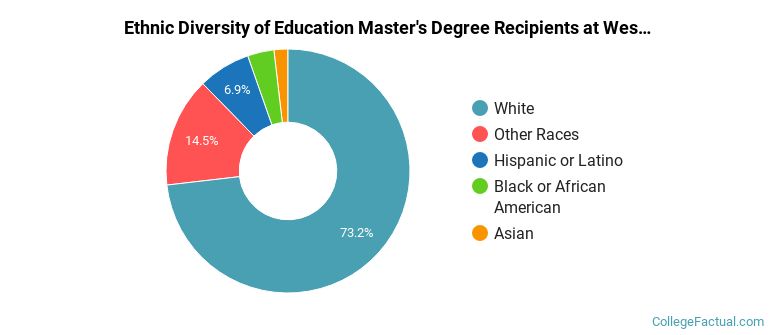
The majority of master's degree recipients in this major at WGU are white. In the most recent graduating class for which data is available, 73% of students fell into this category.
The following table and chart show the ethnic background for students who recently graduated from Western Governors University with a master's in education.
| Ethnic Background | Number of Students |
|---|---|
| Asian | 143 |
| Black or African American | 271 |
| Hispanic or Latino | 536 |
| White | 5,649 |
| Non-Resident Aliens | 0 |
| Other Races | 1,123 |
Take a look at the following statistics related to the make-up of the education majors at Western Governors University.
Education students may decide to major in one of the following focus areas. Individual majors may not be available for all degree levels.
| Major | Annual Graduates |
|---|---|
| Teacher Education Grade Specific | 2,826 |
| Curriculum & Instruction | 2,461 |
| Instructional Media Design | 1,962 |
| Educational Assessment | 1,843 |
| Teacher Education Subject Specific | 1,541 |
| Special Education | 924 |
| Educational Administration | 477 |
| Teaching English or French | 420 |