Here, you'll find out more about the major, including such details as the number of graduates, what degree levels are offered, ethnicity of students, average salaries, and more. In addition, we cover how Yale ranks in comparison to other schools with political science programs.
Go directly to any of the following sections:
Learn about start dates, transferring credits, availability of financial aid, and more by contacting the universities below.
Gain a solid understanding of American political history, the current political landscape, and the major political parties with this online bachelor's from Southern New Hampshire University.
In College Factual's most recent rankings for the best schools for political science majors, Yale came in at #13. This puts it in the top 5% of the country in this field of study. It is also ranked #1 in Connecticut.
During the 2021-2022 academic year, Yale University handed out 137 bachelor's degrees in political science & government. This is an increase of 41% over the previous year when 97 degrees were handed out.
In 2022, 30 students received their master’s degree in political science from Yale. This makes it the #10 most popular school for political science master’s degree candidates in the country.
In addition, 14 students received their doctoral degrees in political science in 2022, making the school the #6 most popular school in the United States for this category of students.
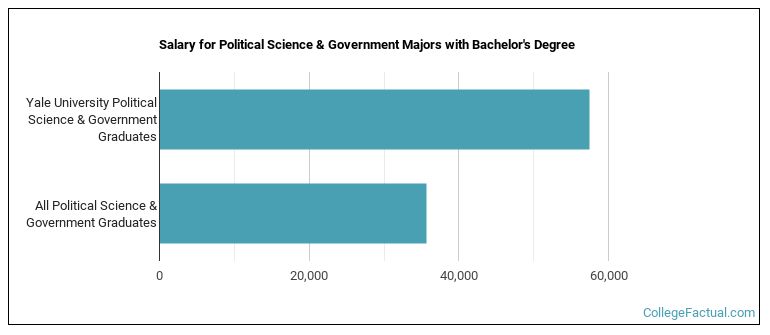
The median salary of political science students who receive their bachelor's degree at Yale is $57,466. This is great news for graduates of the program, since this figure is higher than the national average of $35,631 for all political science bachelor's degree recipients.
Information about average full-time undergraduate tuition and fees is shown in the table below.
| In State | Out of State | |
|---|---|---|
| Tuition | $64,700 | $64,700 |
| Books and Supplies | $1,000 | $1,000 |
| On Campus Room and Board | $19,180 | $19,180 |
| On Campus Other Expenses | $3,420 | $3,420 |
Learn more about Yale tuition and fees.
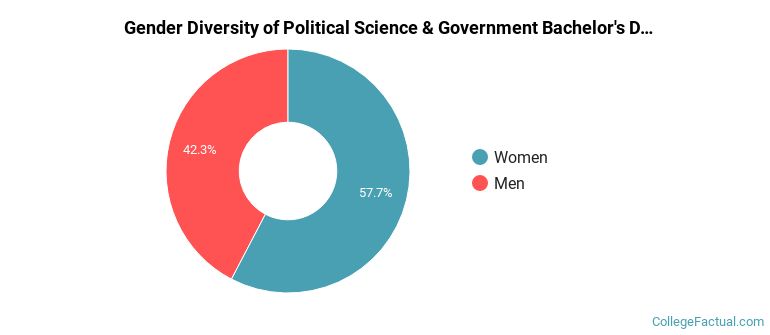
Of the 137 students who graduated with a Bachelor’s in political science from Yale in 2022, 42% were men and 58% were women.
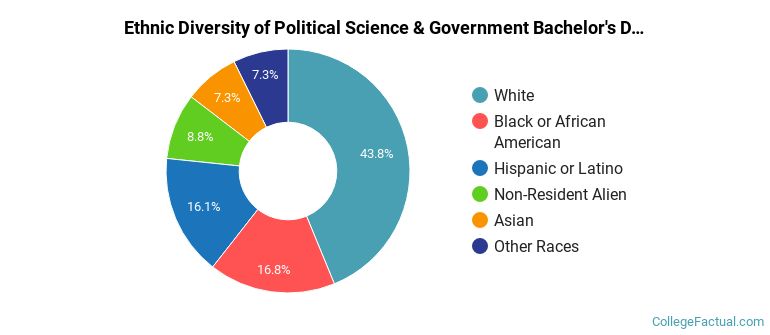
The following table and chart show the ethnic background for students who recently graduated from Yale University with a bachelor's in political science.
| Ethnic Background | Number of Students |
|---|---|
| Asian | 10 |
| Black or African American | 23 |
| Hispanic or Latino | 22 |
| White | 60 |
| Non-Resident Aliens | 12 |
| Other Races | 10 |
Yale does not offer an online option for its political science bachelor’s degree program at this time. To see if the school offers distance learning options in other areas, visit the Yale Online Learning page.
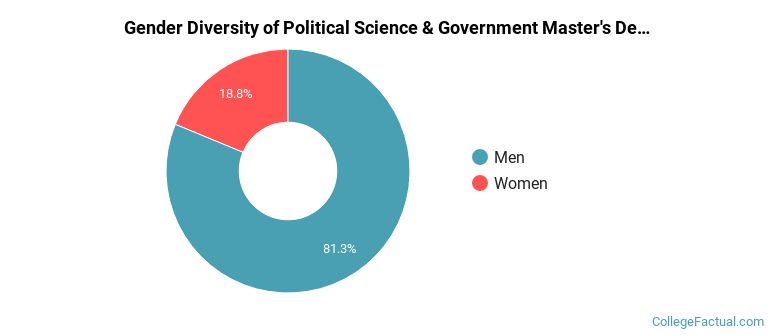
Of the 16 students who earned a master's degree in Political Science & Government from Yale in 2021-2022, 81% were men and 19% were women.
The majority of master's degree recipients in this major at Yale are white. In the most recent graduating class for which data is available, 56% of students fell into this category.
The following table and chart show the ethnic background for students who recently graduated from Yale University with a master's in political science.

| Ethnic Background | Number of Students |
|---|---|
| Asian | 0 |
| Black or African American | 1 |
| Hispanic or Latino | 2 |
| White | 9 |
| Non-Resident Aliens | 4 |
| Other Races | 0 |
Take a look at the following statistics related to the make-up of the political science majors at Yale University.
| Related Major | Annual Graduates |
|---|---|
| Economics | 284 |
| International Relations & National Security | 97 |
| Sociology | 40 |
| Anthropology | 35 |
| Archeology | 10 |
More about our data sources and methodologies.
