Women make up 56.5% of the total graduate student body at CCSJ while men make you 43.5%. These percentages may be different for specific degree programs.

Of all the graduate students at CCSJ, around 49.3% belong to a racial-ethnic minority group. The chart below shows the breakdown of graduate student demographics at the school. You can click on it for a more detailed view.

The average graduate full-time tuition and fees is shown in the table below.
| In-State | Out-of-State | |
|---|---|---|
| Tuition | $20,640 | $20,640 |
| Fees | $860 | $860 |
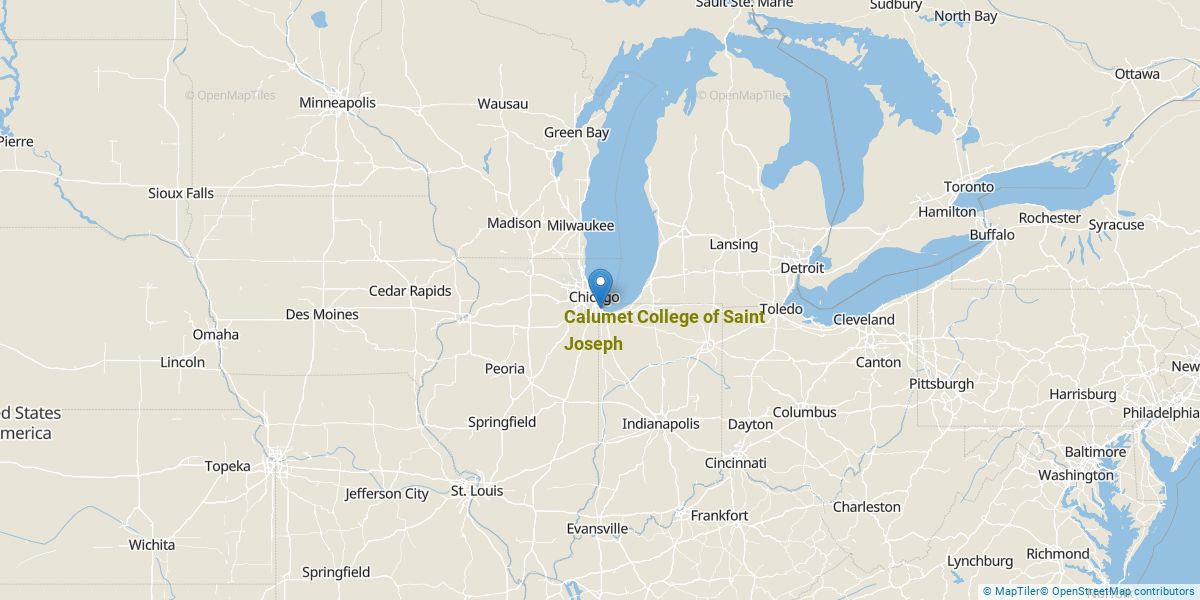
Get more details about the location of Calumet College of Saint Joseph.
Contact details for CCSJ are given below.
| Contact Details | |
|---|---|
| Address: | 2400 New York Ave, Whiting, IN 46394 |
| Phone: | 219-473-7770 |
| Website: | www.ccsj.edu/ |
| Facebook: | http://www.facebook.com/pages/Calumet-College-of-Saint-Joseph/126226035224 |
| Twitter: | https://twitter.com/_CCSJ |
Around 67.8% of CCSJ graduate students took at least one course online during the 2020-2021 academic year. For that same period, 57.4% of grad students took all of their classes online.

The only degree programs listed here are those in which master’s degrees were awarded in 2020-2021.
| Master’s Degree Program | Annual Graduates |
|---|---|
| Business Administration & Management | 1 |
| General Psychology | 8 |
Footnotes
*The racial-ethnic minorities count is calculated by taking the total number of students and subtracting white students, international students, and students whose race/ethnicity was unknown. This number is then divided by the total number of students at the school to obtain the racial-ethnic minorities percentage.
References
More about our data sources and methodologies.