The main focus area for this major is Finance. For more details on this concentration, visit its profile page.
Finance & Financial Management is a major offered under the business, management and marketing program of study at Capella University. Here, you’ll find out more about the major doctor’s degree program in finance, including such details as the number of graduates, ethnicity of students, related majors and concentrations, and more.
If there’s something special you’re looking for, you can use one of the links below to find it:
Part-time graduates at Capella University paid an average of $547 per credit hour in 2019-2020. This tuition was the same for both in-state and out-of-state students. The following table shows the average full-time tuition and fees for graduate student.
| In State | Out of State | |
|---|---|---|
| Tuition | $14,767 | $14,767 |
Learn about other programs related to <nil> that might interest you.
Managing and quantifying money is at the heart of the online bachelor's degree in finance at SNHU. You'll learn the fundamentals of investments, address key managerial issues, examine ethics from every angle and build the skillset to be a player in the multidimensional business marketplace.
Prepare to advance your current career in finance with Southern New Hampshire University's online Master's in Finance degree program.
Looking for online learning options? Good news, you can take online classes in the finance doctor’s degree program at Capella University. To see if the school offers distance learning options in other areas, visit the Capella University Online Learning page.
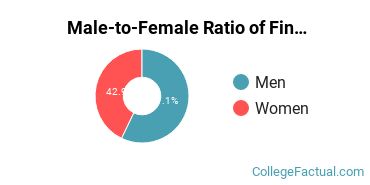
Of the students who received their doctor’s degree in finance in 2019-2020, 42.9% of them were women. This is higher than the nationwide number of 34.0%.
Racial-ethnic minority graduates* made up 71.4% of the finance doctor’s degrees at Capella University in 2019-2020. This is higher than the nationwide number of 20%.
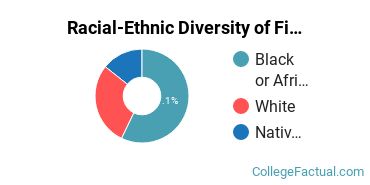
| Race/Ethnicity | Number of Students |
|---|---|
| Asian | 0 |
| Black or African American | 4 |
| Hispanic or Latino | 0 |
| Native American or Alaska Native | 1 |
| Native Hawaiian or Pacific Islander | 0 |
| White | 2 |
| International Students | 0 |
| Other Races/Ethnicities | 0 |
Finance & Financial Management students may decide to major in one of the following focus areas.
| Focus Area | Annual Graduates |
|---|---|
| Finance | 7 |
You may also be interested in one of these majors related to finance and financial management.
| Related Major | Annual Graduates |
|---|---|
| General Business/Commerce | 4 |
| Business Administration & Management | 110 |
| Accounting | 11 |
| Human Resource Management | 15 |
| Management Information Systems | 2 |
*The racial-ethnic minorities count is calculated by taking the total number of students and subtracting white students, international students, and students whose race/ethnicity was unknown. This number is then divided by the total number of students at the school to obtain the racial-ethnic minorities percentage.
More about our data sources and methodologies.
