Adult & Continuing Education is a concentration offered under the teacher education grade specific major at Capella University. We’ve pulled together some essential information you should know about the master’s degree program in adult and continuing ed, including how many students graduate each year, the ethnic diversity of these students, whether or not the degree is offered online, and more.
If there’s something special you’re looking for, you can use one of the links below to find it:
During the 2019-2020 academic year, part-time graduate students at Capella University paid an average of $0 per credit hour. No discount was available for in-state students. The following table shows the average full-time tuition and fees for graduate student.
| In State | Out of State | |
|---|---|---|
| Tuition | $14,767 | $14,767 |
If you’re interested in online learning, you’re in luck. Capella University does offer online classes in its adult and continuing ed master’s degree program. To see if the school offers distance learning options in other areas, visit the Capella University Online Learning page.
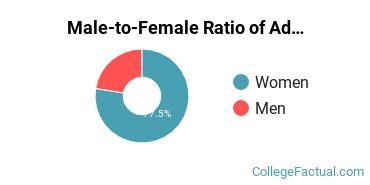
Women made up around 90.5% of the adult and continuing ed students who took home a master’s degree in 2019-2020. This is higher than the nationwide number of 70.2%.
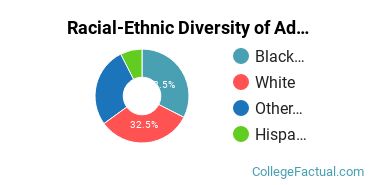
Racial-ethnic minority graduates* made up 28.6% of the adult and continuing ed master’s degrees at Capella University in 2019-2020. This is lower than the nationwide number of 37%.
| Race/Ethnicity | Number of Students |
|---|---|
| Asian | 0 |
| Black or African American | 4 |
| Hispanic or Latino | 1 |
| Native American or Alaska Native | 0 |
| Native Hawaiian or Pacific Islander | 1 |
| White | 12 |
| International Students | 0 |
| Other Races/Ethnicities | 3 |
You may also be interested in one of these majors related to adult and continuing education.
| Related Major | Annual Graduates |
|---|---|
| Early Childhood Education | 67 |
| Teacher Development & Methodology | 24 |
View All Adult & Continuing Education Related Majors >
*The racial-ethnic minorities count is calculated by taking the total number of students and subtracting white students, international students, and students whose race/ethnicity was unknown. This number is then divided by the total number of students at the school to obtain the racial-ethnic minorities percentage.
More about our data sources and methodologies.