Statistics is a concentration offered under the statistics major at Carnegie Mellon University. Here, you’ll find out more about the major doctor’s degree program in stats, including such details as the number of graduates, ethnicity of students, related majors and concentrations, and more.
If there’s something special you’re looking for, you can use one of the links below to find it:
Learn about start dates, transferring credits, availability of financial aid, and more by contacting the universities below.
If you have a knack for mathematics and an interest in learning more, study online to achieve your career goals at Southern New Hampshire University. Our mathematics degree can help you enhance your mathematical abilities, including reasoning and problem-solving in three areas: analysis, algebra and statistics.
BA in Mathematics - Applied Mathematics
Put mathematical concepts to work to solve today's most complex real-world problems by studying applied mathematics with this specialized online bachelor's from Southern New Hampshire University.
In 2019-2020, the average part-time graduate tuition at Carnegie Mellon was $633 per credit hour for both in-state and out-of-state students. The average full-time tuition and fees for graduate students are shown in the table below.
| In State | Out of State | |
|---|---|---|
| Tuition | $46,441 | $46,441 |
| Fees | $885 | $885 |
Carnegie Mellon does not offer an online option for its stats doctor’s degree program at this time. To see if the school offers distance learning options in other areas, visit the Carnegie Mellon Online Learning page.
About 8.3% of the students who received their PhD in stats in 2019-2020 were women. This is less than the nationwide number of 36.8%.

Of those graduates who received a doctor’s degree in stats at Carnegie Mellon in 2019-2020, 8.3% were racial-ethnic minorities*. This is about the same as the nationwide number of 10%.
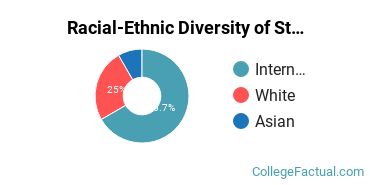
| Race/Ethnicity | Number of Students |
|---|---|
| Asian | 1 |
| Black or African American | 0 |
| Hispanic or Latino | 0 |
| Native American or Alaska Native | 0 |
| Native Hawaiian or Pacific Islander | 0 |
| White | 3 |
| International Students | 8 |
| Other Races/Ethnicities | 0 |
You may also be interested in one of these majors related to statistics.
| Related Major | Annual Graduates |
|---|---|
| Other Statistics | 1 |
View All Statistics Related Majors >
*The racial-ethnic minorities count is calculated by taking the total number of students and subtracting white students, international students, and students whose race/ethnicity was unknown. This number is then divided by the total number of students at the school to obtain the racial-ethnic minorities percentage.
More about our data sources and methodologies.

