The total graduate student population at Hastings is made up of 30.8% women and 69.2% men. Note that these percentages may differ for certain degree programs.

Of all the graduate students at Hastings, around 26.9% belong to a racial-ethnic minority group. Hastings is popular with people from outside the United States, too. International students make up 15.4% of the graduate student population. The following chart shows the distribution of racial-ethnic groups at the school. If you click on it, you'll find more detailed information.

The average graduate full-time tuition and fees is shown in the table below.
| In-State | Out-of-State | |
|---|---|---|
| Tuition | $10,680 | $10,680 |
| Fees | $1,780 | $1,780 |
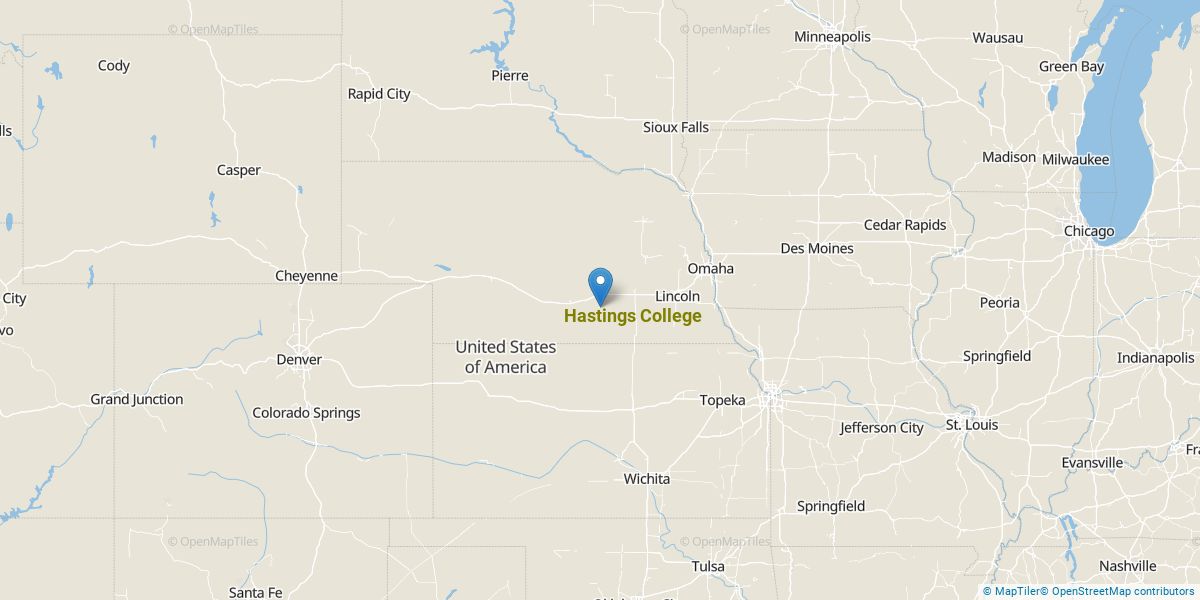
Get more details about the location of Hastings College.
Contact details for Hastings are given below.
| Contact Details | |
|---|---|
| Address: | 710 N Turner Ave, Hastings, NE 68901 |
| Phone: | 402-463-2402 |
| Website: | www.hastings.edu/ |
| Facebook: | https://www.facebook.com/hastings.edu |
| Twitter: | https://twitter.com/HC_Advantage |
During the 2020-2021 academic year, 9.1% of the graduate students at Hastings took at least one online course.

The only degree programs listed here are those in which master’s degrees were awarded in 2020-2021.
| Master’s Degree Program | Annual Graduates |
|---|---|
| Teacher Education Subject Specific | 14 |
| Teaching English or French | 2 |
Footnotes
*The racial-ethnic minorities count is calculated by taking the total number of students and subtracting white students, international students, and students whose race/ethnicity was unknown. This number is then divided by the total number of students at the school to obtain the racial-ethnic minorities percentage.
References
More about our data sources and methodologies.