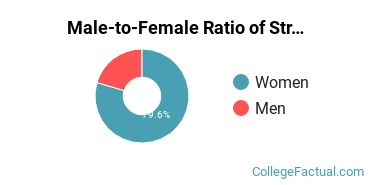
Women make up 79.6% of the total graduate student body at Strayer University - Georgia while men make you 20.4%. These percentages may be different for specific degree programs.
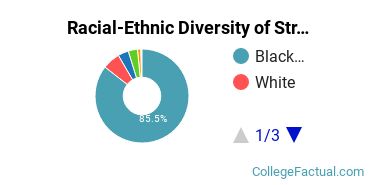
Of all the graduate students at Strayer University - Georgia, around 92.6% belong to a racial-ethnic minority group. Americans aren't the only ones who appreciate the graduate programs at Strayer University - Georgia. Around 0.2% of graduate students are international. The chart below shows the breakdown of graduate student demographics at the school. You can click on it for a more detailed view.
The average tuition and fees for graduate students is shown below.
| In-State | Out-of-State | |
|---|---|---|
| Tuition | $14,940 | $14,940 |
| Fees | $195 | $195 |
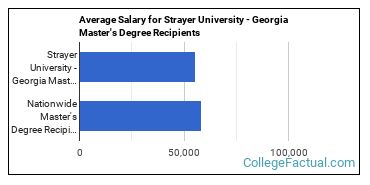
Master's degree recipients from Strayer University - Georgia earn an average salary of $55,502 during the early years of their career. That's about 5% lower than the countrywide average of $58,425 for all master's degree holders.
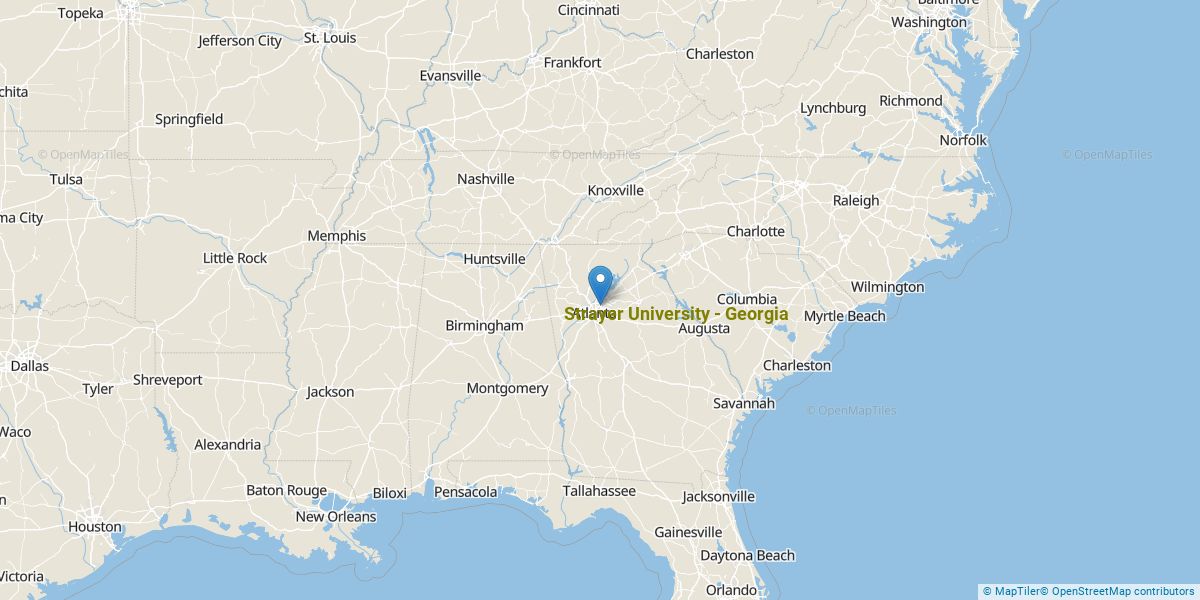
Get more details about the location of Strayer University - Georgia.
Contact details for Strayer University - Georgia are given below.
| Contact Details | |
|---|---|
| Address: | 2965 Flowers Road South, Ste 100, Chamblee, GA 30341 |
| Phone: | 877-445-7180 |
| Website: | www.strayer.edu/campus-locations/georgia/chamblee |
| Facebook: | https://www.facebook.com/StrayerUniversity |
| Twitter: | http://www.twitter.com/strayeru |
During the 2020-2021 academic year, 100.0% of the graduate students at Strayer University - Georgia took all of their courses online.

The only degree programs listed here are those in which master’s degrees were awarded in 2020-2021.
| Master’s Degree Program | Annual Graduates |
|---|---|
| Accounting | 14 |
| Business Administration & Management | 127 |
| Educational Administration | 25 |
| Health & Medical Administrative Services | 27 |
| Human Resource Management | 51 |
| Information Science | 18 |
| Information Technology | 5 |
| Public Administration | 33 |
Footnotes
*The racial-ethnic minorities count is calculated by taking the total number of students and subtracting white students, international students, and students whose race/ethnicity was unknown. This number is then divided by the total number of students at the school to obtain the racial-ethnic minorities percentage.
References
More about our data sources and methodologies.