General History is a concentration offered under the history major at University of Nevada - Las Vegas. Here, you’ll find out more about the major doctor’s degree program in general history, including such details as the number of graduates, diversity of students, and more.
You can jump to any section of this page using the links below:
During the 2019-2020 academic year, part-time graduate students at UNLV paid an average of $624 per credit hour if they came to the school from out-of-state. In-state students paid a discounted rate of $297 per credit hour. The following table shows the average full-time tuition and fees for graduate student.
| In State | Out of State | |
|---|---|---|
| Tuition | $5,675 | $21,328 |
| Fees | $634 | $634 |
UNLV does not offer an online option for its general history doctor’s degree program at this time. To see if the school offers distance learning options in other areas, visit the UNLV Online Learning page.
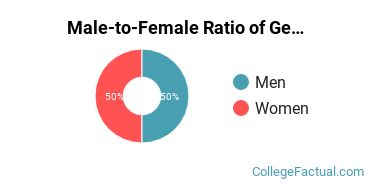
Women made up around 50.0% of the general history students who took home a doctor’s degree in 2019-2020. This is higher than the nationwide number of 41.3%.
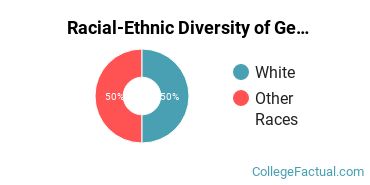
Of those students who received a doctor’s degree at UNLV in general history at 2019-2020, none were racial-ethnic minorities*.
| Race/Ethnicity | Number of Students |
|---|---|
| Asian | 0 |
| Black or African American | 0 |
| Hispanic or Latino | 0 |
| Native American or Alaska Native | 0 |
| Native Hawaiian or Pacific Islander | 0 |
| White | 1 |
| International Students | 0 |
| Other Races/Ethnicities | 1 |
*The racial-ethnic minorities count is calculated by taking the total number of students and subtracting white students, international students, and students whose race/ethnicity was unknown. This number is then divided by the total number of students at the school to obtain the racial-ethnic minorities percentage.
More about our data sources and methodologies.