Go directly to any of the following sections:
The biological & biomedical sciences major at Alvin is not ranked on College Factual’s Best Colleges and Universities for Biological & Biomedical Sciences. This could be for a number of reasons, such as not having enough data on the major or school to make an accurate assessment of its quality.
Out-of-state part-time undergraduates at Alvin paid an average of $155 per credit hour in 2022-2023. The average for in-state students was $102 per credit hour. Information about average full-time undergraduate tuition and fees is shown in the table below.
| In State | Out of State | |
|---|---|---|
| Tuition | $2,448 | $3,720 |
| Fees | $610 | $610 |
| Books and Supplies | $2,043 | $2,043 |
Learn more about Alvin tuition and fees.
Alvin does not offer an online option for its biological & biomedical sciences bachelor’s degree program at this time. To see if the school offers distance learning options in other areas, visit the Alvin Online Learning page.
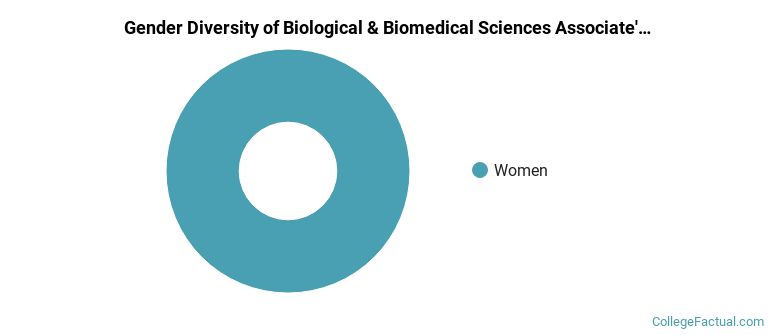
All of the 6 students who graduated with a Associate’s in biological & biomedical sciences from Alvin in 2022 were women.
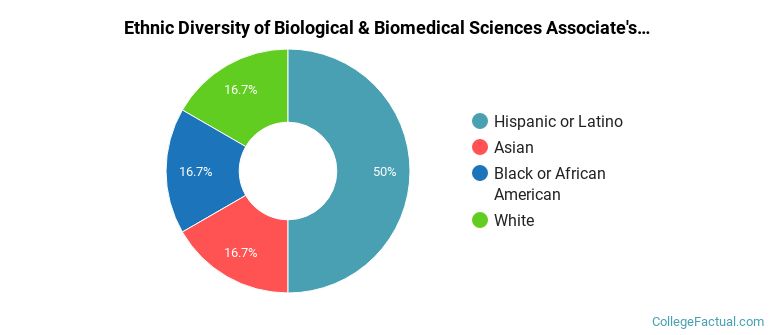
The following table and chart show the ethnic background for students who recently graduated from Alvin Community College with a associate's in biological & biomedical sciences.
| Ethnic Background | Number of Students |
|---|---|
| Asian | 1 |
| Black or African American | 1 |
| Hispanic or Latino | 3 |
| White | 1 |
| Non-Resident Aliens | 0 |
| Other Races | 0 |
Biological & Biomedical Sciences students may decide to major in one of the following focus areas. Individual majors may not be available for all degree levels.
| Major | Annual Graduates |
|---|---|
| General Biology | 6 |
| Related Major | Annual Graduates |
|---|---|
| Science Technologies / Technicians | 121 |
| Mathematics & Statistics | 12 |
| Engineering Technologies | 6 |
| Physical Sciences | 1 |