College Factual analyzes over 2,000 colleges and universities in its annual rankings and ranks them in a variety of ways, including most diverse, best overall quality, best for non-traditional students, and much more.
Babson College was awarded 15 badges in the 2025 rankings. The highest ranked major at the school is general business administration and management.
Explore the best ranked schools for the programs you are most interested in.
Babson College was not ranked in College Factual's Best Overall Colleges report this year. This may be because not enough data was available.
With an acceptance rate of 22%, Babson College is one of the most selective schools in the country. Good grades and high test scores alone may not be enough to get you into the school, so do your best to submit a stellar application.
About 32% of students accepted to Babson College submitted their SAT scores. When looking at the 25th through the 75th percentile, SAT Evidence-Based Reading and Writing scores ranged between 660 and 730. Math scores were between 690 and 780.
The student to faculty ratio at Babson College is about average at 16 to 1. This ratio is often used to gauge how many students might be in an average class and how much time professors will have to spend with their students on an individual level. The national average for this metric is 15 to 1.
Another measure that is often used to estimate how much access students will have to their professors is how many faculty members are full-time. The idea here is that part-time faculty tend to spend less time on campus, so they may not be as available to students as full-timers.
The full-time faculty percentage at Babson College is 100%. This is higher than the national average of 47%.
Babson College has a freshmen retention rate of 95%. That's a good sign that full-time students like the school and their professors enough to want to stick around for another year. It's also a sign that the admissions team did a good job in choosing applicants who were a good fit for the school.
Students are considered to have graduated on time if they finish their studies within four years. At Babson College the on-time graduation rate of first-time, full-time students is 92%. That is great when compared to the national average of 33.3%
Find out more about the retention and graduation rates at Babson College.
During the 2017-2018 academic year, there were 2,457 full-time undergraduates at Babson College.
| $0-30 K | $30K-48K | $48-75 | $75-110K | $110K + |
|---|---|---|---|---|
| $18,765 | $15,344 | $20,854 | $28,556 | $55,303 |
The net price is calculated by adding tuition, room, board and other costs and subtracting financial aid.Note that the net price is typically less than the published for a school. For more information on the sticker price of Babson College, see our tuition and fees and room and board pages.
It's not uncommon for college students to take out loans to pay for school. In fact, almost 66% of students nationwide depend at least partially on loans. At Babson College, approximately 30% of students took out student loans averaging $9,137 a year. That adds up to $36,548 over four years for those students.
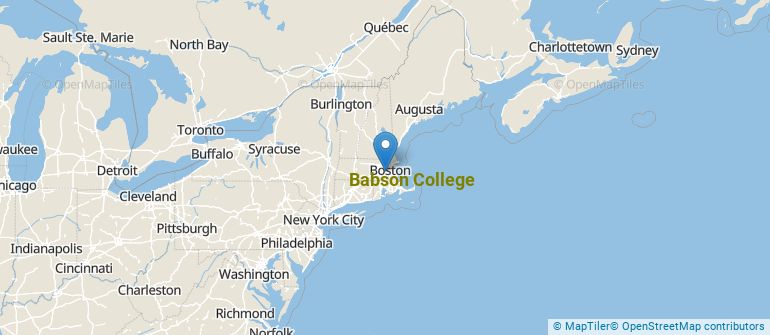
Get more details about the location of Babson College.
Contact details for Babson College are given below.
| Contact Details | |
|---|---|
| Address: | 231 Forest Street, Wellesley, MA 02457-0310 |
| Phone: | 781-235-1200 |
| Website: | www.babson.edu/ |
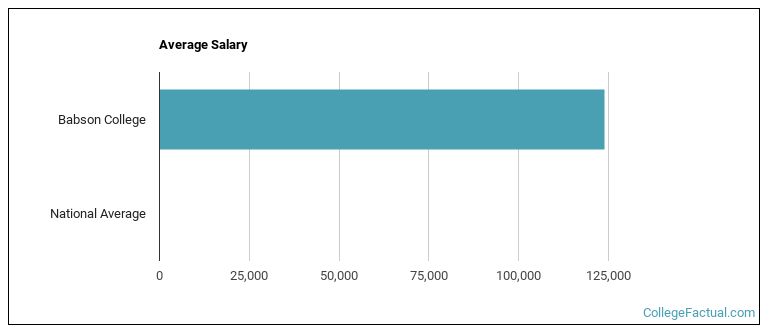
| Most Popular Majors | Bachelor’s Degrees | Average Salary of Graduates |
|---|---|---|
| Business Administration & Management | 1,054 | $69,970 |
| Applied Mathematics | 33 | NA |
| Management Sciences & Quantitative Methods | 28 | NA |
Online learning is becoming popular at even the oldest colleges and universities in the United States. Not only are online classes great for returning adults with busy schedules, they are also frequented by a growing number of traditional students.
In 2022-2023, 919 students took at least one online class at Babson College. This is a decrease from the 1,582 students who took online classes the previous year.
| Year | Took at Least One Online Class | Took All Classes Online |
|---|---|---|
| 2022-2023 | 919 | 404 |
| 2021-2022 | 1,582 | 218 |
| 2020-2021 | 2,652 | 263 |
| 2018-2019 | 50 | 3 |
Footnotes
*The racial-ethnic minorities count is calculated by taking the total number of students and subtracting white students, international students, and students whose race/ethnicity was unknown. This number is then divided by the total number of students at the school to obtain the racial-ethnic minorities percentage.
References
More about our data sources and methodologies.