How diverse is Brenau? College Factual’s diversity report reveals the truth and stats about diversity at Brenau. We analyzed racial demographics, gender ratios, student age ranges, and where students come from.
What does diversity really mean at the college level? College Factual ran the numbers to discover how diverse the standard college campus really is, considering race, gender, the ages of the students, and where they’re from.
Brenau total enrollment is approximately 1,926 students. 856 are undergraduates and 1,070 are graduate students.
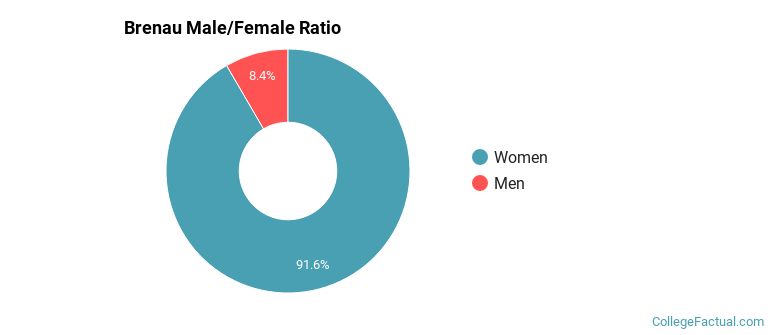
Male/Female Breakdown of Undergraduates
The full-time Brenau undergraduate population is made up of 92.2% women, and 7.8% men.
For the gender breakdown for all students, go here.
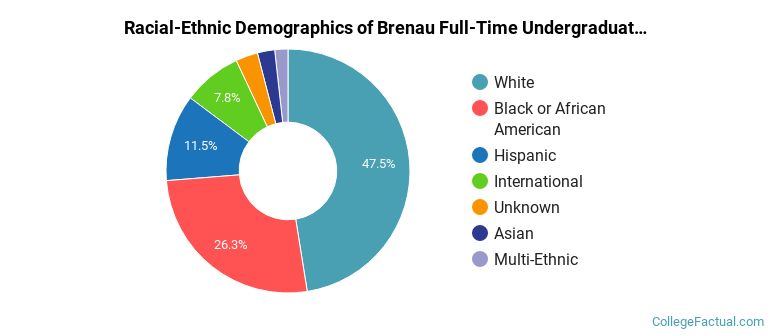
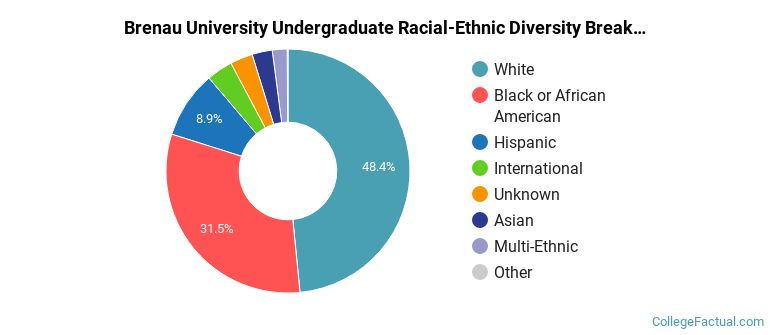
Brenau Racial/Ethnic Breakdown of Undergraduates
| Race/Ethnicity | Number | Percent |
|---|---|---|
| White | 370 | 43.2% |
| Black or African American | 190 | 22.2% |
| Hispanic | 177 | 20.7% |
| International | 60 | 7.0% |
| Multi-Ethnic | 37 | 4.3% |
| Asian | 14 | 1.6% |
| Unknown | 7 | 0.8% |
| Native Hawaiian or Pacific Islander | 1 | 0.1% |
See racial/ethnic breakdown for all students.
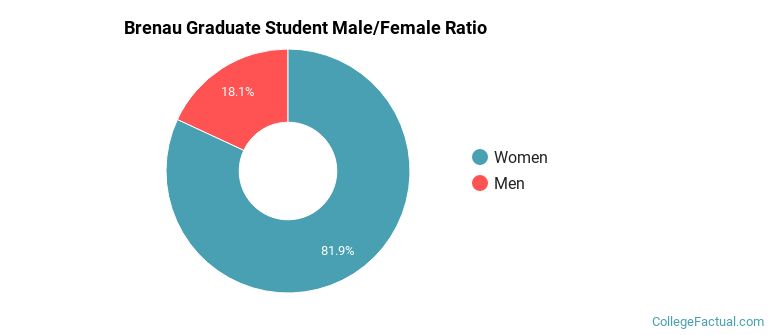
Male/Female Breakdown of Graduate Students
About 82.5% of full-time grad students are women, and 17.5% men.
For the gender breakdown for all students, go here.
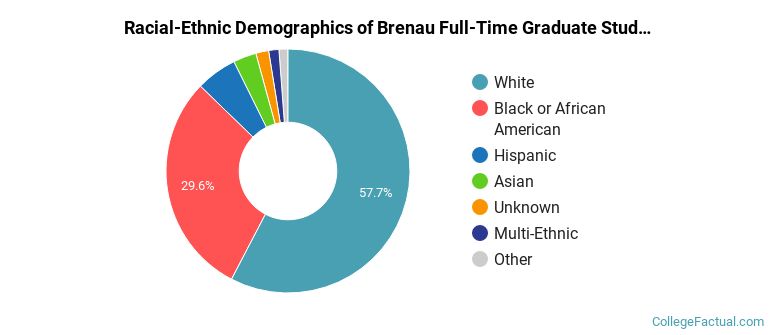
Brenau Racial-Ethnic Breakdown of Graduate Students
| Race/Ethnicity | Number | Percent |
|---|---|---|
| White | 520 | 48.6% |
| Black or African American | 368 | 34.4% |
| Hispanic | 72 | 6.7% |
| Multi-Ethnic | 45 | 4.2% |
| Asian | 43 | 4.0% |
| Unknown | 12 | 1.1% |
| International | 8 | 0.7% |
| Native Hawaiian or Pacific Islander | 1 | 0.1% |
See racial/ethnic breakdown for all students.
| Race/Ethnicity | Number | Percent |
|---|---|---|
| White | 890 | 46.2% |
| Black or African American | 558 | 29.0% |
| Hispanic | 249 | 12.9% |
| Multi-Ethnic | 82 | 4.3% |
| International | 68 | 3.5% |
| Asian | 57 | 3.0% |
| Unknown | 19 | 1.0% |
| Native Hawaiian or Pacific Islander | 2 | 0.1% |
Brenau University faculty racial/ethnic demographics (share of instructional staff):
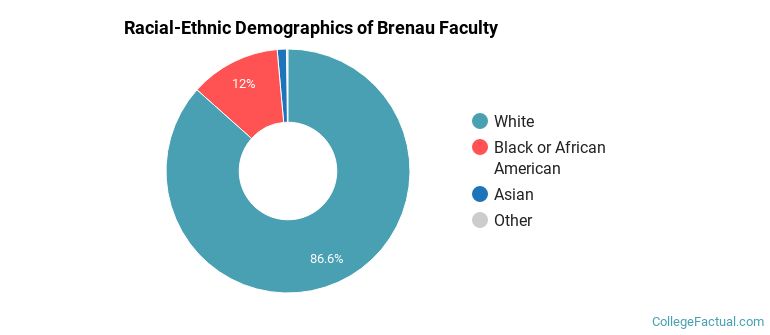
| Ethnicity | Percent of Faculty |
|---|---|
| White | 76.2% |
| Black or African American | 16.9% |
| Hispanic | 3.8% |
| Asian | 3.1% |
This school is more popular with women than with men.
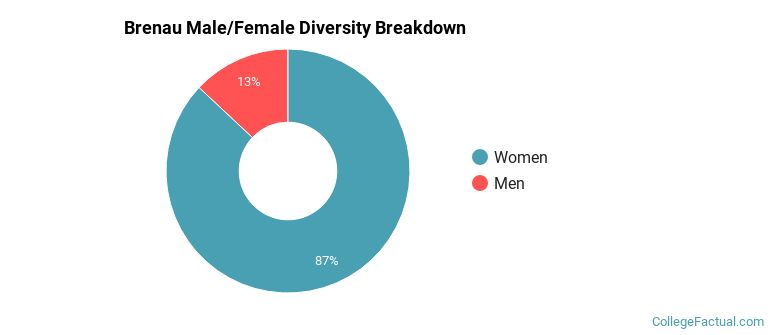
There are approximately 1,672 female students and 254 male students at Brenau.
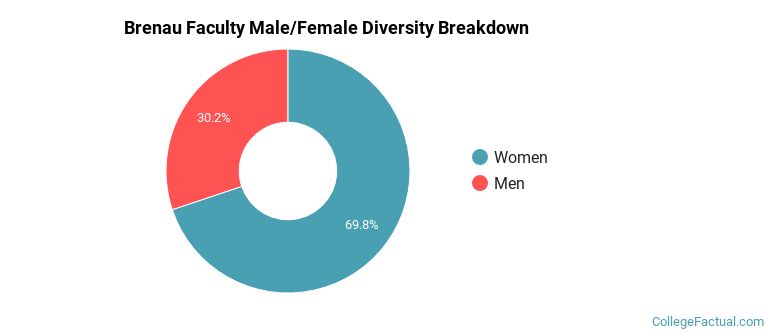
Brenau University faculty gender breakdown (share of instructional staff):
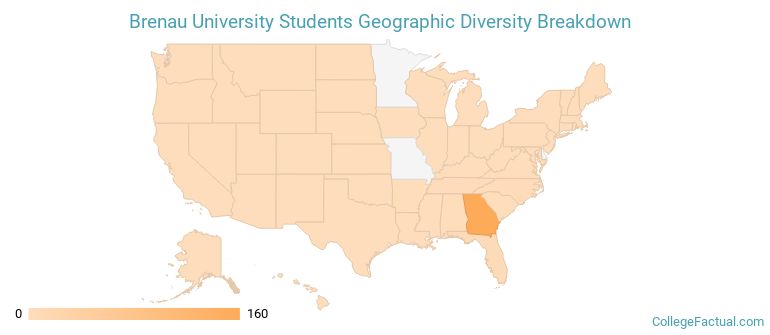
Among first-time degree-seeking undergraduates, 95.9% of Brenau students come from within the state, and 4.1% come from out of state.
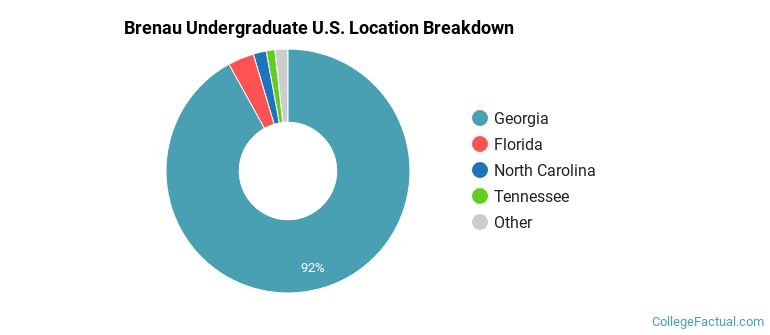
The undergraduate student body is split among 12 states (may include Washington D.C.). Click on the map for more detail.
| State | Amount | Percent |
|---|---|---|
| Georgia | 269 | 94.4% |
| Florida | 3 | 1.1% |
| Texas | 3 | 1.1% |
| Alabama | 2 | 0.7% |
| California | 1 | 0.4% |
Brenau hosts approximately 3.5% international (nonresident) students, adding to the multicultural environment of the campus.
A traditional college student is defined as being between the ages of 18-21. At Brenau, 27.8% of undergraduate students fall into that category, compared to the national average of 60%.
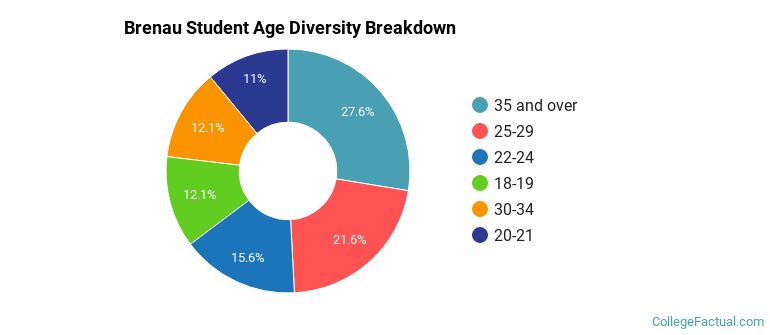
Student Age Group Amount Percent 35 and over 523 21.5% 25-29 443 18.2% 18-19 425 17.4% 22-24 358 14.7% 20-21 252 10.3% 30-34 226 9.3% Under 18 209 8.6%
Footnotes
*The racial-ethnic minorities count is calculated by taking the total number of students and subtracting white students, international students, and students whose race/ethnicity was unknown. This number is then divided by the total number of students at the school to obtain the racial-ethnic minorities percentage.
References