Here is an overview of this program at Cal State San Bernardino. You can study it at the Bachelor’s level, with graduate study also available. It ranks as high as #40 out of 48 schools (Bachelor’s level) by College Factual. Jump to any of the following sections:
College Factual rates Cal State San Bernardino highly for fine & studio arts, ranked #365 out of 664 schools nationally.
| Ranking | Rank |
|---|---|
| Best Fine & Studio Arts Schools | 365 of 664 |
| Best Fine & Studio Arts Schools in California | 57 of 127 |
The table below lists every degree level offered in fine & studio arts at Cal State San Bernardino, along with how many graduates complete each level annually.
| Degree Level | Annual Graduates |
|---|---|
| Bachelor’s | 64 |
| Master’s | 7 |
During the most recent reporting year, California State University-San Bernardino handed out 64 bachelor’s degrees in fine & studio arts.
Cal State San Bernardino ranks competitively among schools offering fine & studio arts at the bachelor’s level. In particular it placed #40 out of 48 schools by College Factual.
Fine & Studio Arts graduates with a bachelor’s degree from Cal State San Bernardino earn a median of $28,068 a year. This is lower than $54,146, the median for all majors at Cal State San Bernardino.
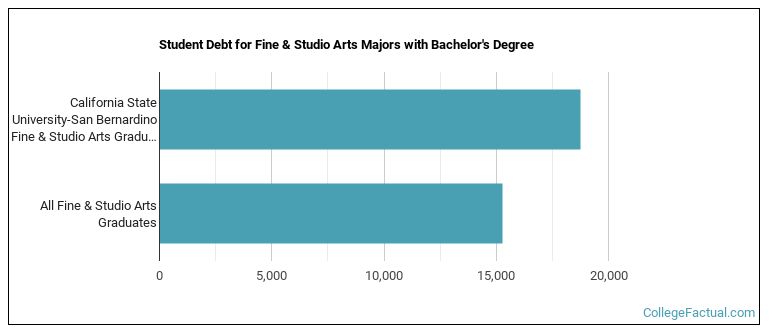
While getting their bachelor’s degree at Cal State San Bernardino, fine & studio arts students borrow a median amount of $18,750 in student loans. This is higher than $15,274, the typical median for all majors at Cal State San Bernardino.
The full-time undergraduate tuition and fees are shown below.
| In State | Out of State | |
|---|---|---|
| Tuition | $5,742 | $18,684 |
| Fees | $2,004 | $2,004 |
Find out more about Cal State San Bernardino tuition and fees.
Among recent graduates, 30% of fine & studio arts bachelor’s degrees went to men and 70% went to women.
 The majority of fine & studio arts bachelor’s degree graduates at Cal State San Bernardino were Hispanic or Latino. About 72% of graduates fell into this category.
The following table and chart show the ethnic background for students who recently graduated from California State University-San Bernardino with a bachelor’s in fine & studio arts.
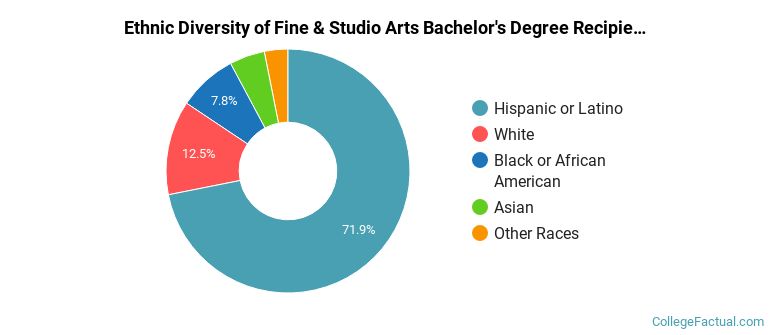
| Ethnic Background | Number of Students |
|---|---|
| Asian | 3 |
| Black or African American | 5 |
| Hispanic or Latino | 46 |
| White | 8 |
| Non-Resident Aliens | 0 |
| Other Races | 2 |
Cal State San Bernardino conferred 58 bachelor’s degrees in art/art studies, general in the most recent reporting year — 69% to women and 31% to men. Most of these graduates identified as Hispanic or Latino (74%).
Cal State San Bernardino conferred 3 bachelor’s degrees in art history, criticism and conservation in the latest year of data — 100% to women and 0% to men. Most of these graduates identified as Asian (33%).
Cal State San Bernardino granted 3 bachelor’s completions in fine/studio arts, general recently — 67% to women and 33% to men. Most of these graduates identified as Hispanic or Latino (67%).
You can also pursue this field at the graduate level at Cal State San Bernardino. Annual graduate completions by level are shown below.
| Graduate Level | Annual Graduates |
|---|---|
| Master’s Degrees in Fine & Studio Arts | 7 |
