We’ve pulled together the essential facts you should know about the program at CSM. Degrees are awarded at the Associate’s level. Jump to any of the following sections:
The following degree levels are offered in general social sciences at CSM, along with how many graduates complete each level annually.
| Degree Level | Annual Graduates |
|---|---|
| Associate’s | 153 |
During the most recent reporting year, College of San Mateo awarded 153 associate’s degrees in general social sciences.
CSM is not yet ranked for general social sciences at the associate’s level.
Average full-time tuition and fees are listed in the table below.
| In State | Out of State | |
|---|---|---|
| Tuition | $1,288 | $11,384 |
| Fees | $44 | $44 |
Find out more about CSM tuition and fees.
Among recent graduates, 45% of general social sciences associate’s degrees went to men and 55% went to women.
 The largest share of general social sciences associate’s degree graduates at CSM were Hispanic or Latino. Approximately 35% of graduates fell into this category.
The following table and chart show the ethnic background for students who recently graduated from College of San Mateo with a associate’s in general social sciences.
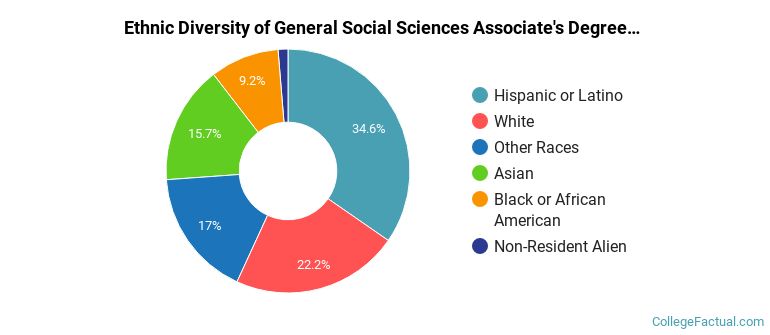
| Ethnic Background | Number of Students |
|---|---|
| Asian | 24 |
| Black or African American | 14 |
| Hispanic or Latino | 53 |
| White | 34 |
| Non-Resident Aliens | 2 |
| Other Races | 26 |
CSM awarded 153 associate’s completions in social sciences, general in the most recent reporting year — 55% to women and 45% to men. Most of these graduates identified as Hispanic or Latino (35%).
More about our data sources and methodologies.