Here is an overview of this program at Davenport University. Degrees are awarded at the Bachelor’s, Associate’s levels, with graduate study also available. Its best result is a rank of #15 out of 31 schools (Bachelor’s level) by College Factual. Jump to any of the following sections:
College Factual ranks Davenport University among the top schools in the country for business administration & management, coming in at #950 out of 2,027 schools nationally.
| Ranking | Rank |
|---|---|
| Best Business Administration & Management Schools | 950 of 2,027 |
| Best Business Administration & Management Schools in Michigan | 27 of 62 |
| Best Business Administration & Management Schools in the Great Lakes Region | 147 of 278 |
Here is each degree level available for business administration & management at Davenport University, along with how many graduates complete each level annually.
| Degree Level | Annual Graduates |
|---|---|
| Bachelor’s | 162 |
| Associate’s | 1 |
| Master’s | 120 |
| Graduate Certificate | 1 |
| Professional Certificate | 19 |
For the most recent IPEDS reporting year, Davenport University awarded 162 bachelor’s degrees in business administration & management.
Davenport University is a solid choice among schools offering business administration & management at the bachelor’s level. Its best result was #15 out of 31 schools by College Factual.
Business Administration & Management graduates with a bachelor’s degree from Davenport University go on to jobs where they make a median salary of $68,512 a year. This is above $61,187, the median for all majors at Davenport University.
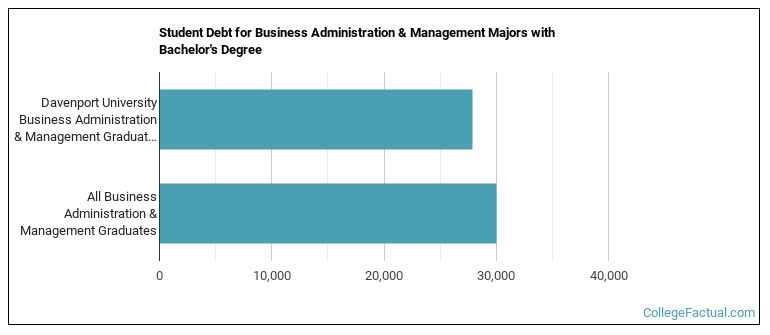
Earning a bachelor’s degree at Davenport University, business administration & management students borrow a median amount of $27,898 in student loans. This is below $30,054, the typical median for all majors at Davenport University.
The full-time undergraduate tuition and fees are shown below.
| In State | Out of State | |
|---|---|---|
| Tuition | $20,064 | $23,376 |
| Fees | $1,090 | $1,090 |
Learn more about Davenport University tuition and fees.
Among recent graduates, 61% of business administration & management bachelor’s degrees went to men and 39% went to women.
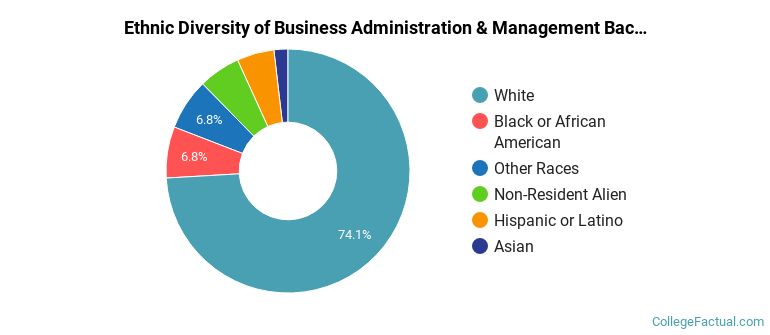
 The largest share of business administration & management bachelor’s degree graduates at Davenport University are White. About 74% of graduates fell into this category.
The following table and chart show the ethnic background for students who recently graduated from Davenport University with a bachelor’s in business administration & management.
| Ethnic Background | Number of Students |
|---|---|
| Asian | 3 |
| Black or African American | 11 |
| Hispanic or Latino | 8 |
| White | 120 |
| Non-Resident Aliens | 9 |
| Other Races | 11 |
Davenport University awarded 145 bachelor’s degrees in business administration and management, general recently — 38% to women and 62% to men. The most common background among these graduates was White (74%).
Davenport University conferred 12 bachelor’s degrees in business administration, management and operations, other in the most recent reporting year — 67% to women and 33% to men. Most of these graduates identified as White (58%).
Davenport University granted 3 bachelor’s degrees in operations management and supervision in the most recent reporting year — 0% to women and 100% to men. The most common background among these graduates was White (100%).
Davenport University conferred 2 bachelor’s degrees in organizational leadership recently — 0% to women and 100% to men. The most common background among these graduates was White (100%).
In the most recent year for which we have data, Davenport University awarded 1 associate’s degree in business administration & management.
Davenport University has not been ranked for business administration & management at the associate’s level.
Every one of the 1 student who graduated with a associate’s degree in business administration & management from Davenport University identified as men.
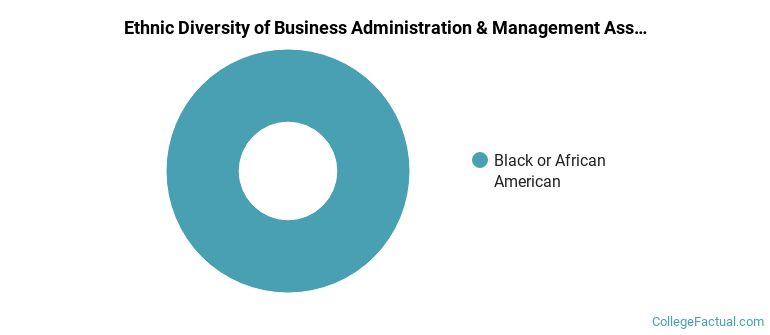
 The majority of business administration & management associate’s degree graduates at Davenport University were Black or African American. Approximately 100% of graduates fell into this category.
The following table and chart show the ethnic background for students who recently graduated from Davenport University with a associate’s in business administration & management.
| Ethnic Background | Number of Students |
|---|---|
| Asian | 0 |
| Black or African American | 1 |
| Hispanic or Latino | 0 |
| White | 0 |
| Non-Resident Aliens | 0 |
| Other Races | 0 |
Davenport University granted 1 associate’s degree in business administration and management, general in the latest year of data — 0% to women and 100% to men. The most common background among these graduates was Black or African American (100%).
This program is also offered at the graduate level at Davenport University. Annual graduate completions by level are shown below.
