Below are the key facts about this program at Johns Hopkins. Degrees are awarded at the Bachelor’s level, with graduate study also available. Its best result is a rank of #4 out of 5 schools (Bachelor’s level) by College Factual. Jump to any of the following sections:
By College Factual’s measure, Johns Hopkins among the top schools in the country for music, ranked #91 out of 416 schools nationally.
| Ranking | Rank |
|---|---|
| Best Music Schools | 91 of 416 |
| Best Music Schools in Maryland | 2 of 5 |
| Best Music Schools in the Middle Atlantic Region | 14 of 70 |
The table below lists every degree level available for music at Johns Hopkins, along with how many graduates complete each level annually.
| Degree Level | Annual Graduates |
|---|---|
| Bachelor’s | 82 |
| Master’s | 122 |
| Doctoral | 18 |
| Graduate Certificate | 16 |
In the most recent year for which we have data, Johns Hopkins University awarded 82 bachelor’s degrees in music.
Johns Hopkins is among the very best schools in the country for music at the bachelor’s level. Specifically, it ranked #4 out of 5 schools by College Factual.
| Ranking | Rank |
|---|---|
| Best Music Bachelor’s Degree Schools in Maryland | 4 |
| Best Music Bachelor’s Degree Schools in the Middle Atlantic Region | 20 |
| Best Music Bachelor’s Degree Schools | 132 |
Music majors who earn their bachelor’s degree from Johns Hopkins report a median salary of $23,945 a year. This is lower than $98,753, the median for all majors at Johns Hopkins.
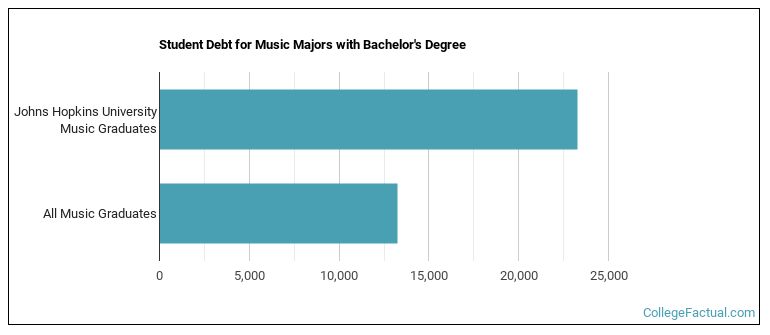
To complete a bachelor’s at Johns Hopkins, music students accumulate a median of $23,250 in student loans. This is above $13,276, the typical median for all majors at Johns Hopkins.
Information about average full-time undergraduate tuition and fees is shown in the table below.
| In State | Out of State | |
|---|---|---|
| Tuition | $58,720 | $64,730 |
Find out more about Johns Hopkins tuition and fees.
Among recent graduates, 56% of music bachelor’s degrees went to men and 44% went to women.
 The largest share of music bachelor’s degree graduates at Johns Hopkins were White. Roughly 40% of graduates fell into this category.
The following table and chart show the ethnic background for students who recently graduated from Johns Hopkins University with a bachelor’s in music.

| Ethnic Background | Number of Students |
|---|---|
| Asian | 16 |
| Black or African American | 2 |
| Hispanic or Latino | 9 |
| White | 33 |
| Non-Resident Aliens | 16 |
| Other Races | 6 |
Johns Hopkins granted 69 bachelor’s degrees in music performance, general recently — 52% to women and 48% to men. Most of these graduates identified as White (36%).
Johns Hopkins awarded 7 bachelor’s degrees in music technology recently — 0% to women and 100% to men. The largest share of these graduates were White (57%).
Johns Hopkins conferred 6 bachelor’s degrees in music theory and composition in the latest year of data — 0% to women and 100% to men. The largest share of these graduates were White (67%).
You can also pursue this field at the graduate level at Johns Hopkins. The following graduate award levels are reported.
| Graduate Level | Annual Graduates |
|---|---|
| Master’s Degrees in Music | 122 |
| Doctoral Degrees in Music | 18 |
| Graduate Certificate Degrees in Music | 16 |
