We've pulled together some essential information you should know about the program, including how many students graduate each year, the ethnic diversity of these students, average starting salaries, and more. We've also included details on how Purdue University Global ranks compared to other colleges offering a major in business administration.
Jump to any of the following sections:
Learn about start dates, transferring credits, availability of financial aid, and more by contacting the universities below.
Take your first step toward a career in the business field with this online associate degree from Southern New Hampshire University.
Gain supervisory and managerial expertise you can use throughout your career at Southern New Hampshire University. Our business degree program focuses on developing skilled professionals who can apply proven leadership skills in a variety of roles.
When you go for your online MBA from Southern New Hampshire University, you make the decision to earn the degree that fits both your professional and personal life.
The bachelor's program at Purdue University Global was ranked #422 on College Factual's Best Schools for business administration list. It is also ranked #12 in Indiana.
During the 2020-2021 academic year, Purdue University Global handed out 805 bachelor's degrees in business administration and management. Due to this, the school was ranked #18 in popularity out of all colleges and universities that offer this degree. This is an increase of 33% over the previous year when 604 degrees were handed out.
In 2021, 592 students received their master’s degree in business administration from Purdue University Global. This makes it the #25 most popular school for business administration master’s degree candidates in the country.
Business Administration majors who earn their bachelor's degree from Purdue University Global go on to jobs where they make a median salary of $47,866 a year. This is higher than $41,334, which is the national median for all business administration bachelor's degree recipients.

Graduates of the master's business administration program at Purdue University Global make a median salary of $52,920. This is less than what their typical peers from other schools make. Their median salary is $63,566.

While getting their bachelor's degree at Purdue University Global, business administration students borrow a median amount of $50,723 in student loans. This is higher than the the typical median of $26,545 for all business administration majors across the country.

Learn about other programs related to Business Administration & Management that might interest you.
Today's managers must have a versatile skill set. They are the proponents of an organization's brand and MS manage and develop top talent.
Take charge with an affordable leadership MBA built to fit your budget at Southern New Hampshire University.
MS in Organizational Leadership
Managing and motivating individuals and teams within the workplace takes a manager with effective leadership strategies and techniques.
Take a look at the following statistics related to the make-up of the business administration majors at Purdue University Global.
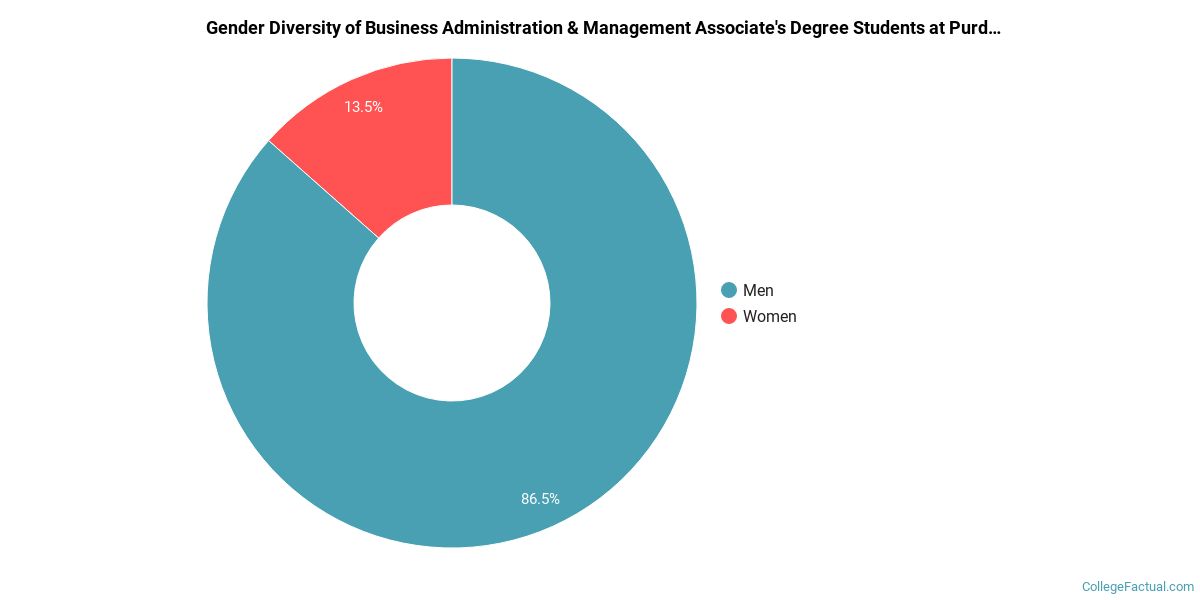
Of the 349 students who earned an associate's degree in Business Administration & Management from Purdue University Global in 2020-2021, 87% were men and 13% were women.
The majority of associate's degree recipients in this major at Purdue University Global are white. In the most recent graduating class for which data is available, 50% of students fell into this category.
The following table and chart show the ethnic background for students who recently graduated from Purdue University Global with a associate's in business administration.

| Ethnic Background | Number of Students |
|---|---|
| Asian | 7 |
| Black or African American | 78 |
| Hispanic or Latino | 62 |
| White | 175 |
| Non-Resident Aliens | 0 |
| Other Races | 27 |
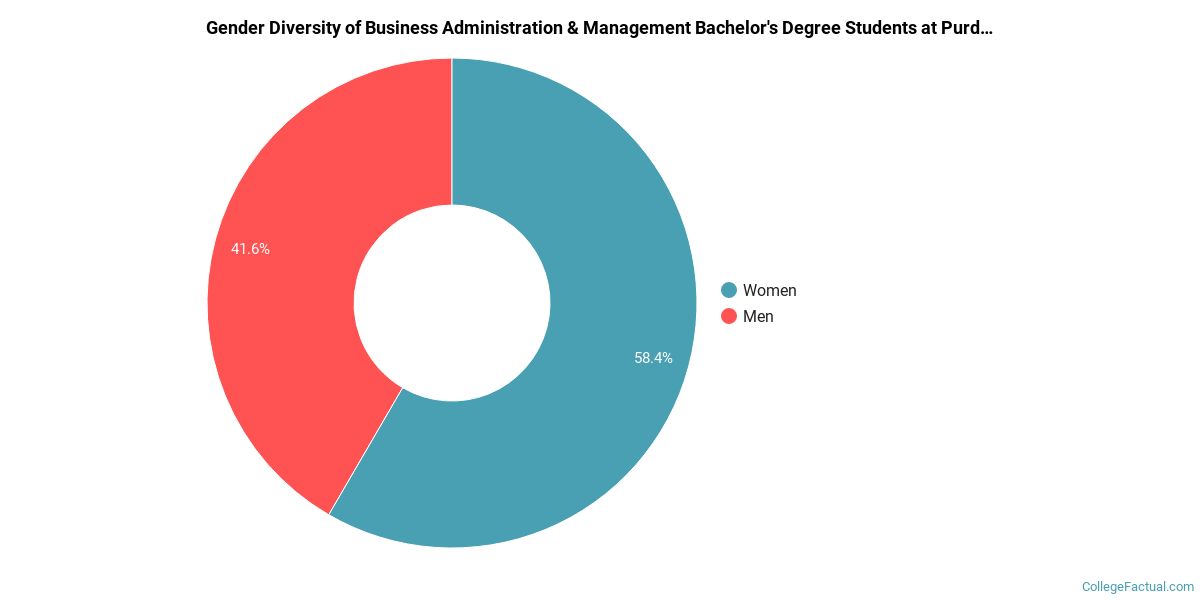
Of the 805 students who earned a bachelor's degree in Business Administration & Management from Purdue University Global in 2020-2021, 42% were men and 58% were women.
The majority of the students with this major are white. About 63% of 2021 graduates were in this category.
The following table and chart show the ethnic background for students who recently graduated from Purdue University Global with a bachelor's in business administration.

| Ethnic Background | Number of Students |
|---|---|
| Asian | 17 |
| Black or African American | 134 |
| Hispanic or Latino | 88 |
| White | 510 |
| Non-Resident Aliens | 1 |
| Other Races | 55 |
During the 2020-2021 academic year, 592 business administration majors earned their master's degree from Purdue University Global. Of these graduates, 46% were men and 54% were women.

The majority of master's degree recipients in this major at Purdue University Global are white. In the most recent graduating class for which data is available, 61% of students fell into this category.
The following table and chart show the ethnic background for students who recently graduated from Purdue University Global with a master's in business administration.
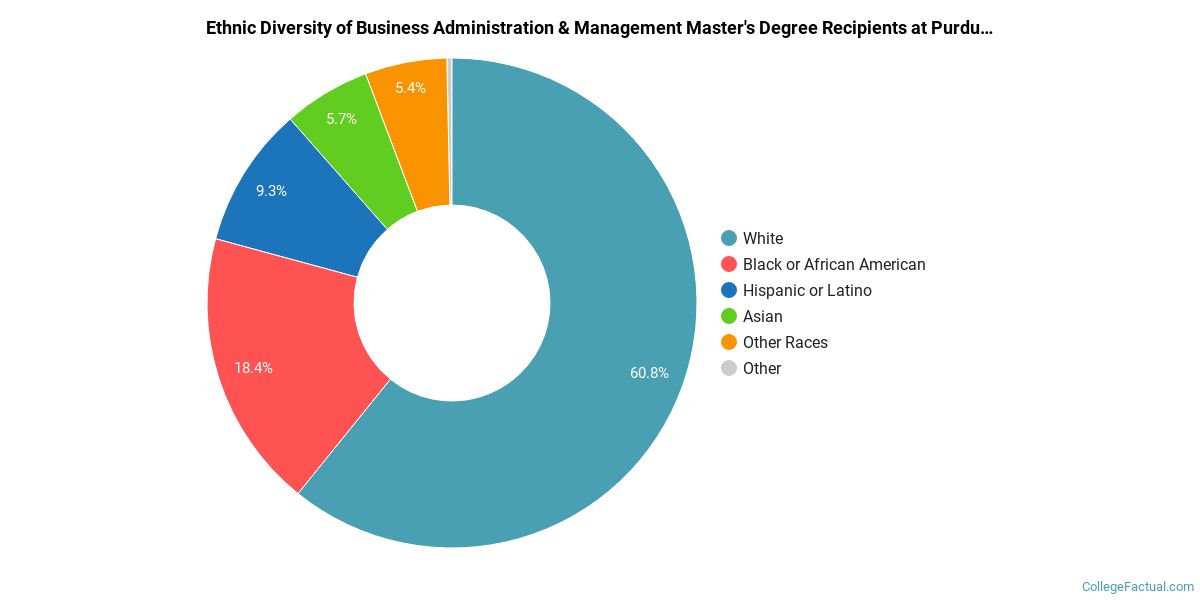
| Ethnic Background | Number of Students |
|---|---|
| Asian | 34 |
| Black or African American | 109 |
| Hispanic or Latino | 55 |
| White | 360 |
| Non-Resident Aliens | 2 |
| Other Races | 32 |
| Related Major | Annual Graduates |
|---|---|
| Accounting | 509 |
| General Business/Commerce | 344 |
| Human Resource Management | 138 |
| Finance & Financial Management | 62 |
| Entrepreneurial Studies | 12 |
View All Business Administration & Management Related Majors >
More about our data sources and methodologies.
