We've gathered data and other essential information about the program, such as the average salary of graduates, ethnicity of students, how many students graduated in recent times, and more. Also, learn how Purdue University Global ranks among other schools offering degrees in criminal justice.
Go directly to any of the following sections:
Learn about start dates, transferring credits, availability of financial aid, and more by contacting the universities below.
Gain a solid foundation in the American justice system, criminal law and social science when you earn your associate degree in criminal justice online from Southern New Hampshire University.
Navigating today's complex criminal justice system takes a great communicator with real–world perspective. The goal of SNHU's Bachelor of Science in Criminal Justice is to get you there. You'll learn from professionals across all disciplines who bring their experience to the classroom.
Gain the management, leadership, data analysis and budgeting skills you need to advance in the criminal justice field with this online master's from Southern New Hampshire University.
Ranked at #9 in College Factual's most recent rankings, Purdue University Global is in the top 1% of the country for criminal justice students pursuing a bachelor's degree. It is also ranked #1 in Indiana.
During the 2020-2021 academic year, Purdue University Global handed out 467 bachelor's degrees in criminal justice and corrections. Due to this, the school was ranked #7 in popularity out of all colleges and universities that offer this degree. This is an increase of 18% over the previous year when 396 degrees were handed out.
In 2021, 70 students received their master’s degree in criminal justice from Purdue University Global. This makes it the #24 most popular school for criminal justice master’s degree candidates in the country.
Criminal Justice majors who earn their bachelor's degree from Purdue University Global go on to jobs where they make a median salary of $41,882 a year. This is great news for graduates of the program, since this figure is higher than the national average of $34,135 for all criminal justice bachelor's degree recipients.

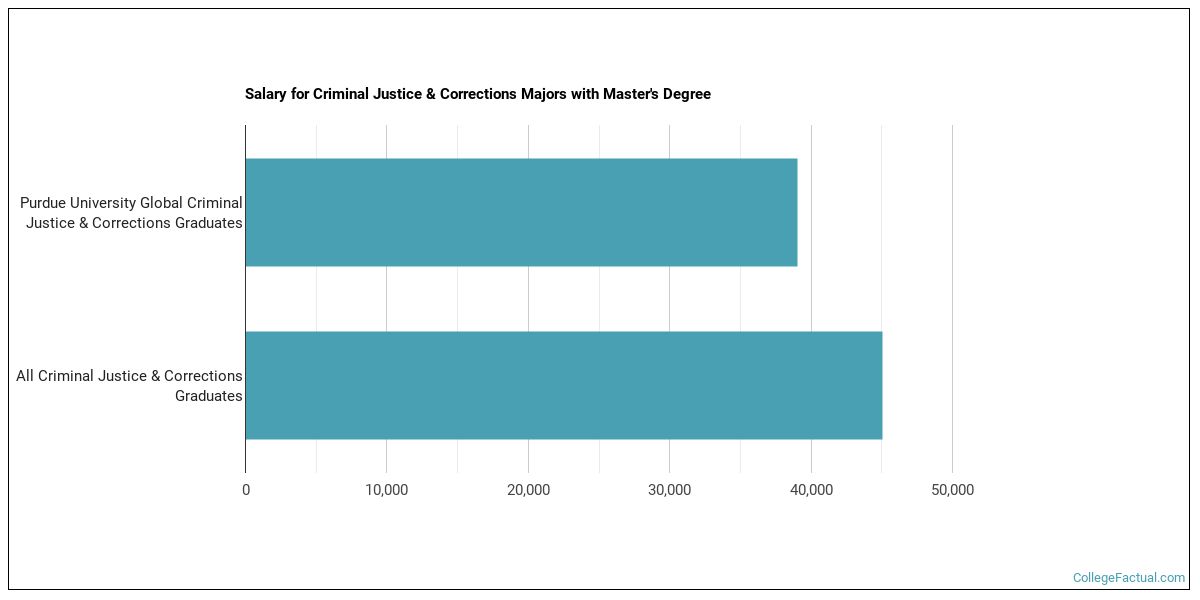
Criminal Justice majors graduating with a master's degree from Purdue University Global make a median salary of $39,070 a year. This is less than what their typical peers from other schools make. Their median salary is $45,048.
While getting their bachelor's degree at Purdue University Global, criminal justice students borrow a median amount of $43,771 in student loans. This is higher than the the typical median of $27,000 for all criminal justice majors across the country.

Take a look at the following statistics related to the make-up of the criminal justice majors at Purdue University Global.
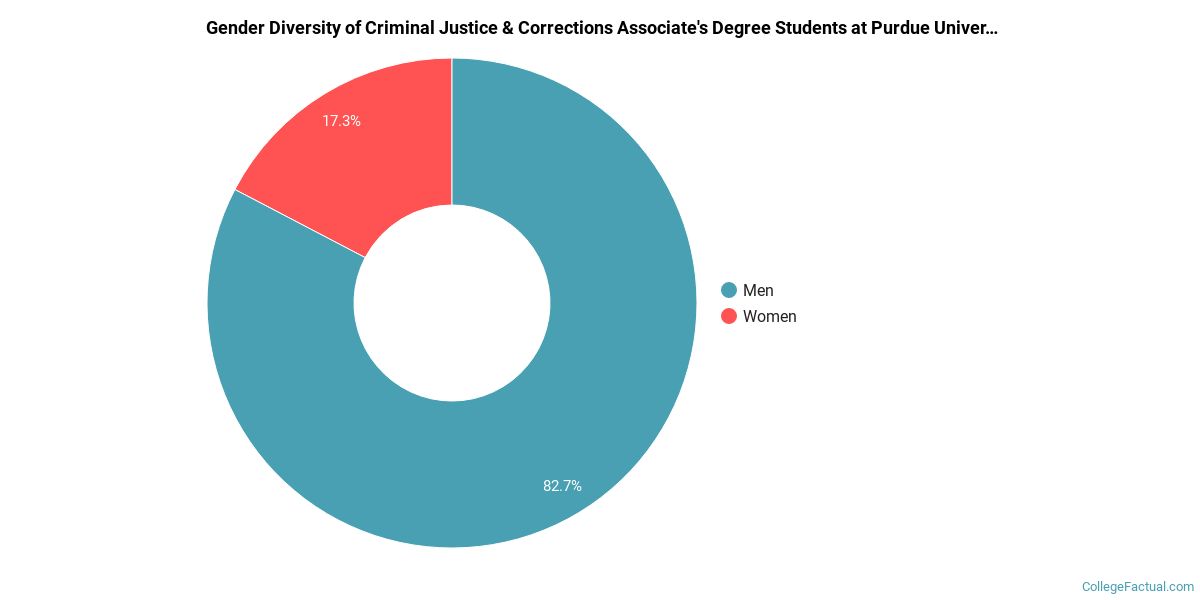
The criminal justice program at Purdue University Global awarded 300 associate's degrees in 2020-2021. About 83% of these degrees went to men with the other 17% going to women.
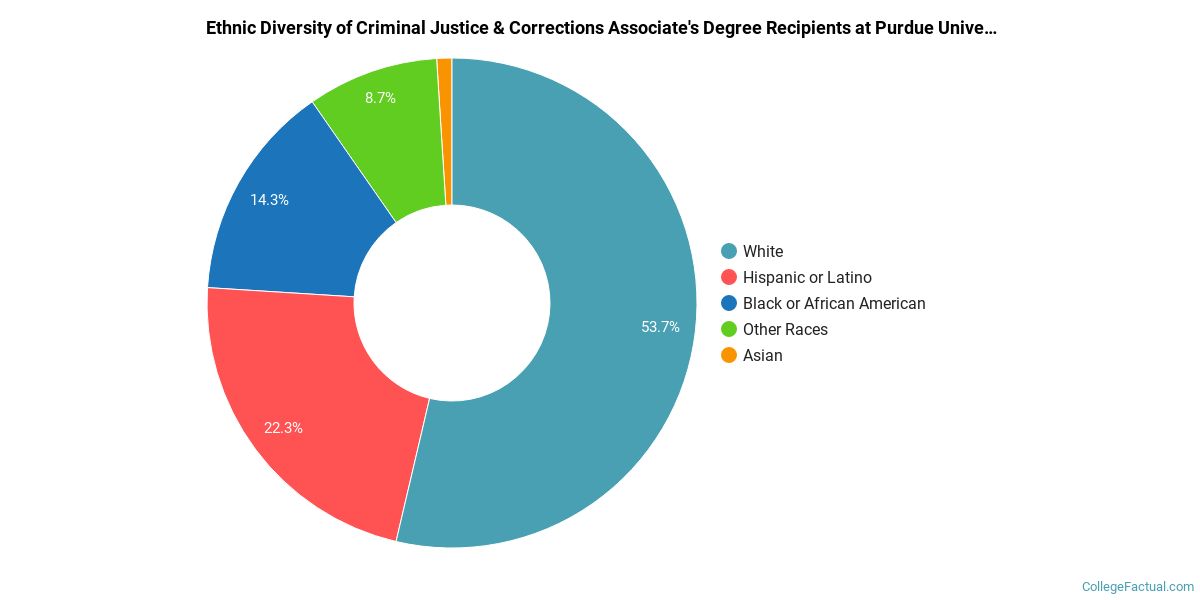
The majority of associate's degree recipients in this major at Purdue University Global are white. In the most recent graduating class for which data is available, 54% of students fell into this category.
The following table and chart show the ethnic background for students who recently graduated from Purdue University Global with a associate's in criminal justice.
| Ethnic Background | Number of Students |
|---|---|
| Asian | 3 |
| Black or African American | 43 |
| Hispanic or Latino | 67 |
| White | 161 |
| Non-Resident Aliens | 0 |
| Other Races | 26 |
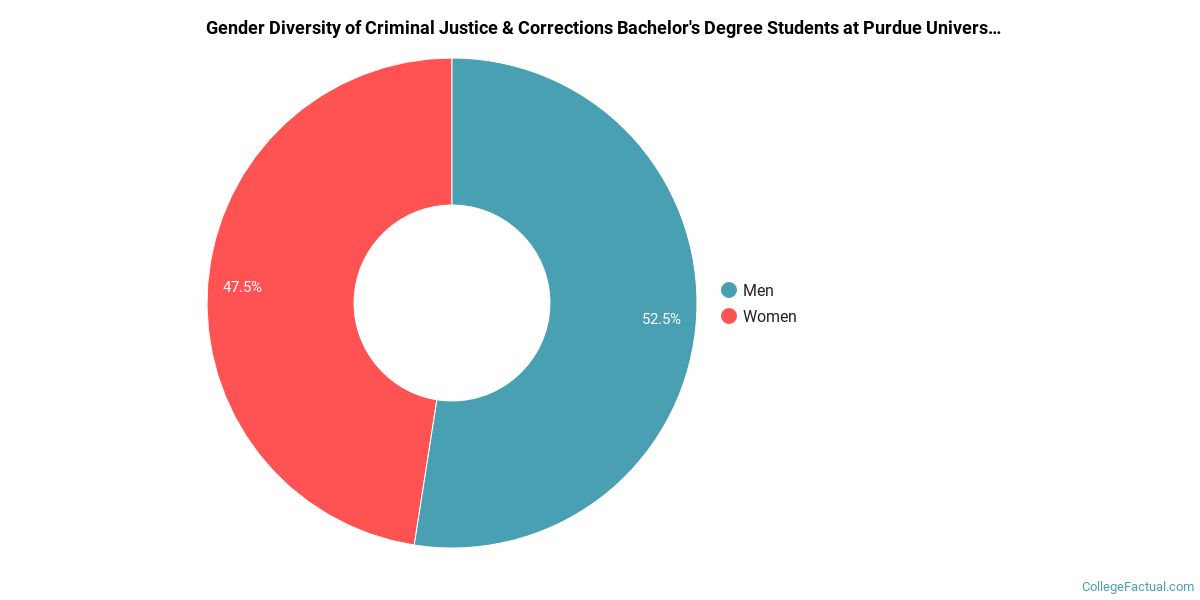
During the 2020-2021 academic year, 467 criminal justice majors earned their bachelor's degree from Purdue University Global. Of these graduates, 52% were men and 48% were women.
The majority of the students with this major are white. About 58% of 2021 graduates were in this category.
The following table and chart show the ethnic background for students who recently graduated from Purdue University Global with a bachelor's in criminal justice.
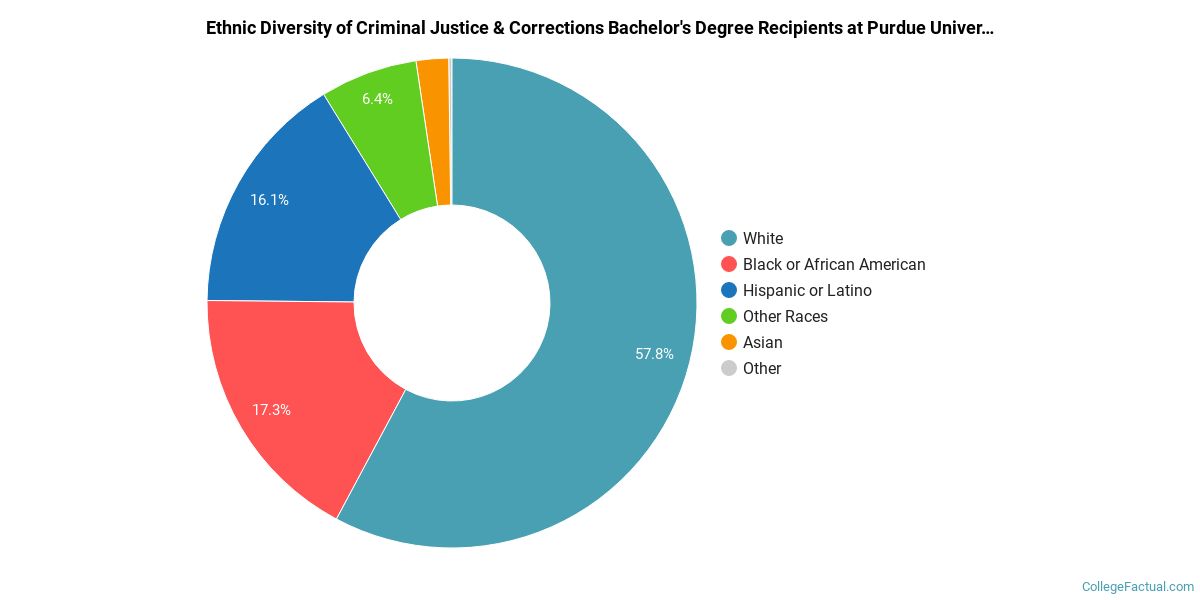
| Ethnic Background | Number of Students |
|---|---|
| Asian | 10 |
| Black or African American | 81 |
| Hispanic or Latino | 75 |
| White | 270 |
| Non-Resident Aliens | 1 |
| Other Races | 30 |
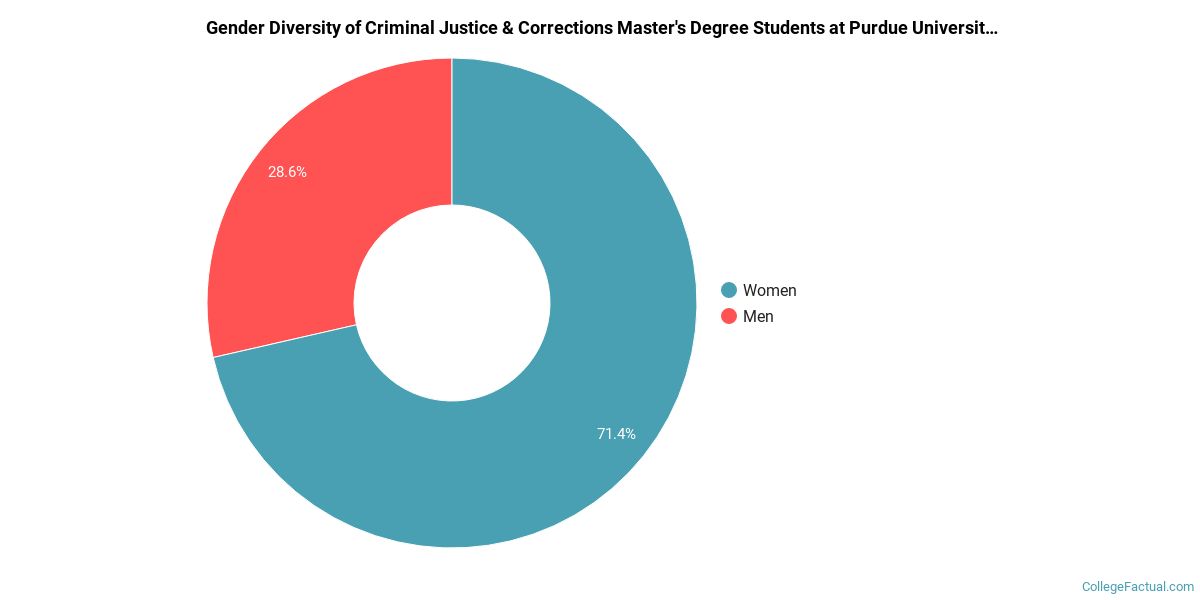
The criminal justice program at Purdue University Global awarded 70 master's degrees in 2020-2021. About 29% of these degrees went to men with the other 71% going to women.
The majority of the students with this major are white. About 57% of 2021 graduates were in this category.
The following table and chart show the ethnic background for students who recently graduated from Purdue University Global with a master's in criminal justice.
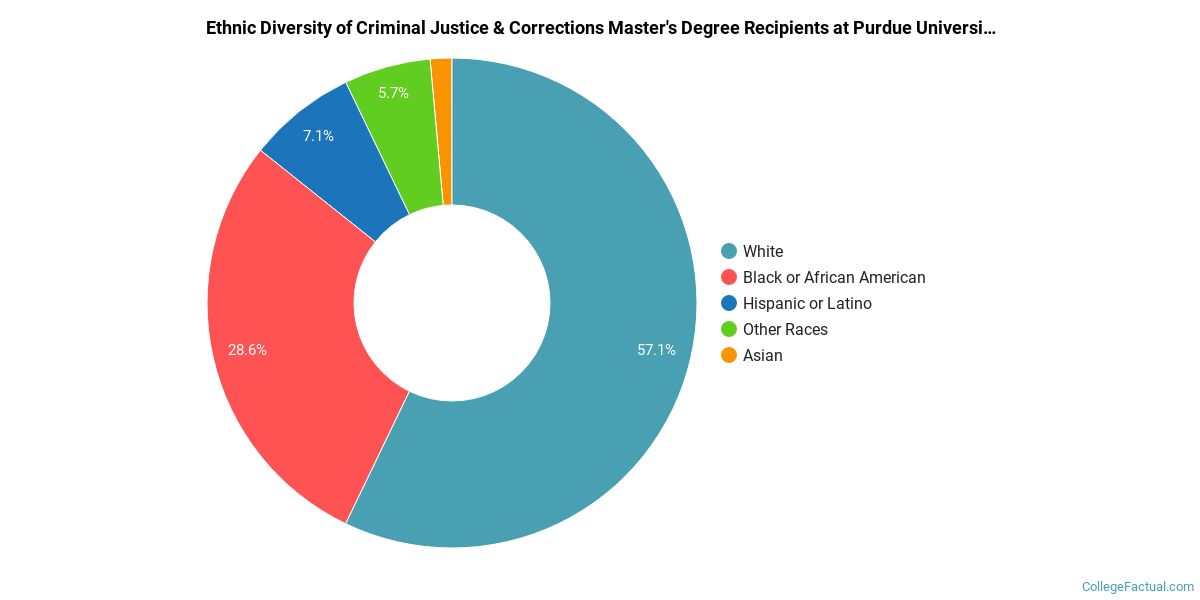
| Ethnic Background | Number of Students |
|---|---|
| Asian | 1 |
| Black or African American | 20 |
| Hispanic or Latino | 5 |
| White | 40 |
| Non-Resident Aliens | 0 |
| Other Races | 4 |
| Related Major | Annual Graduates |
|---|---|
| Fire Protection | 242 |
View All Criminal Justice & Corrections Related Majors >
More about our data sources and methodologies.
