College Factual recognizes the best colleges and universities in its annual rankings. These rankings include categories for best overall colleges, best colleges for each major, best value schools, and much more.
Lawrence University was awarded 2 badges in the 2025 rankings. The highest ranked major at the school is music.
Explore the best ranked schools for the programs you are most interested in.
Lawrence U landed the #877 spot in College Factual's 2025 ranking of best overall colleges in the United States. The higher ed experts analyzed 2,152 colleges and universities across the nation to determine this ranking.
Lawrence U is also ranked #32 out of 46 schools in Wisconsin.
When it comes to admittance, Lawrence University is somewhat selective. Its acceptance rate is 72%, which means you'll face some strong competition during the admissions process. Do what you can to make your application stand out.
About 26% of students accepted to Lawrence U submitted their SAT scores. When looking at the 25th through the 75th percentile, SAT Evidence-Based Reading and Writing scores ranged between 610 and 740. Math scores were between 600 and 720.
The student to faculty ratio is often used to measure the number of teaching resources that a college or university offers its students. The national average for this metric is 15 to 1, but at Lawrence U it is much better at 8 to 1. That's good news for students who want to interact more on a personal level with their teachers.
In addition to the student to faculty ratio, some people look at what percentage of faculty members are full-time as a sign of how much time professors will be able to spend with their students. This is because part-time teachers may not be be on campus as much as their full-time counterparts.
The full-time faculty percentage at Lawrence University is 85%. This is higher than the national average of 47%.
The freshmen retention rate of 88% tells us that most first-year, full-time students like Lawrence University enough to come back for another year. This is a fair bit higher than the national average of 68%. That's certainly something to check off in the good column about the school.
Students are considered to have graduated on time if they finish their studies within four years. At Lawrence U the on-time graduation rate of first-time, full-time students is 63%. That is great when compared to the national average of 33.3%
Find out more about the retention and graduation rates at Lawrence University.
During the 2017-2018 academic year, there were 1,430 undergraduates at Lawrence U with 1,393 being full-time and 37 being part-time.
| $0-30 K | $30K-48K | $48-75 | $75-110K | $110K + |
|---|---|---|---|---|
| $12,482 | $14,503 | $16,832 | $20,640 | $30,316 |
The net price is calculated by adding tuition, room, board and other costs and subtracting financial aid.Note that the net price is typically less than the published for a school. For more information on the sticker price of Lawrence U, see our tuition and fees and room and board pages.
Almost 66% of college students who graduated with the class of 2018 took out student loans, but that percentage varies from school to school. At Lawrence U, approximately 55% of students took out student loans averaging $7,322 a year. That adds up to $29,288 over four years for those students.
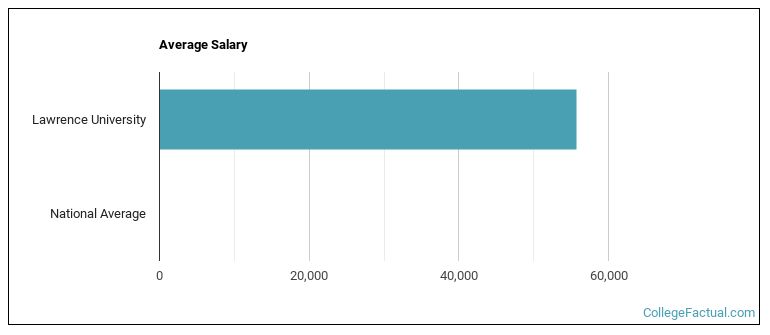
See which majors at Lawrence University make the most money.
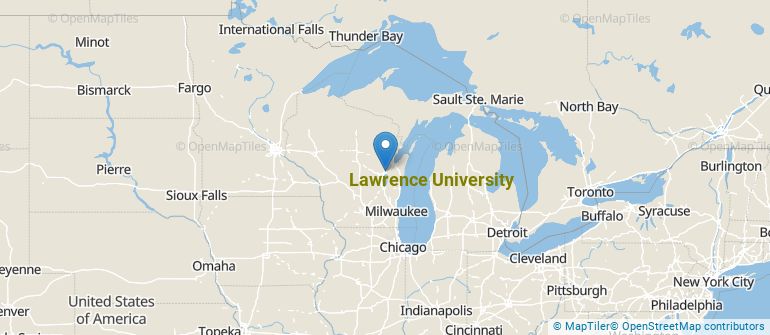
Get more details about the location of Lawrence University.
Contact details for Lawrence U are given below.
| Contact Details | |
|---|---|
| Address: | College Ave, Appleton, WI 54911 |
| Phone: | 920-832-7000 |
| Website: | https://www.lawrence.edu/ |
| Most Popular Majors | Bachelor’s Degrees | Average Salary of Graduates |
|---|---|---|
| Music | 57 | NA |
| General Biology | 35 | NA |
| General Psychology | 30 | NA |
| Economics | 28 | NA |
| Political Science & Government | 24 | NA |
| Fine & Studio Arts | 23 | NA |
| Natural Resources Conservation | 22 | NA |
| General English Literature | 19 | NA |
| History | 14 | NA |
| Biochemistry, Biophysics & Molecular Biology | 13 | NA |
Footnotes
*The racial-ethnic minorities count is calculated by taking the total number of students and subtracting white students, international students, and students whose race/ethnicity was unknown. This number is then divided by the total number of students at the school to obtain the racial-ethnic minorities percentage.
References
More about our data sources and methodologies.