In its yearly rankings, College Factual analyzes over 2,000 colleges and universities to determine which ones are the best in a variety of categories, such as overall value, quality, diversity, which schools are the best for each major, and much more.
Marymount University was awarded 16 badges in the 2025 rankings. The highest ranked major at the school is mental health counseling/counselor.
Explore the best ranked schools for the programs you are most interested in.
College Factual ranked Marymount as #449 out of 2,152 colleges and universities in the country on its 2025 Best Colleges list. This is an improvement over the previous year, when Marymount held the #574 spot on the Best Overall Colleges list.
Marymount is also ranked #14 out of 57 schools in Virginia.
The acceptance rate at Marymount University is 81%. That's higher than the rate at many schools, but still low enough to be considered somewhat selective. If you want to get in, you'll need good grades and to be able to show that Marymount is a good fit for you.
The student to faculty ratio at Marymount University is about average at 13 to 1. This ratio is often used to gauge how many students might be in an average class and how much time professors will have to spend with their students on an individual level. The national average for this metric is 15 to 1.
When estimating how much access students will have to their teachers, some people like to look at what percentage of faculty members are full time. This is because part-time teachers may not have as much time to spend on campus as their full-time counterparts.
The full-time faculty percentage at Marymount University is 50%. This is comparable to the national average of 47%.
Marymount University has a freshmen retention rate of 75%. That's a good sign that full-time students like the school and their professors enough to want to stick around for another year. It's also a sign that the admissions team did a good job in choosing applicants who were a good fit for the school.
The on-time graduation rate for someone pursuing a bachelor's degree is typically four years. This rate at Marymount for first-time, full-time students is 41%, which is better than the national average of 33.3%.
Find out more about the retention and graduation rates at Marymount University.
During the 2017-2018 academic year, there were 2,041 undergraduates at Marymount with 1,861 being full-time and 180 being part-time.
| $0-30 K | $30K-48K | $48-75 | $75-110K | $110K + |
|---|---|---|---|---|
| $21,926 | $22,981 | $22,991 | $25,735 | $24,775 |
The net price is calculated by adding tuition, room, board and other costs and subtracting financial aid.Note that the net price is typically less than the published for a school. For more information on the sticker price of Marymount, see our tuition and fees and room and board pages.
While almost two-thirds of students nationwide take out loans to pay for college, the percentage may be quite different for the school you plan on attending. At Marymount, approximately 48% of students took out student loans averaging $8,603 a year. That adds up to $34,412 over four years for those students.
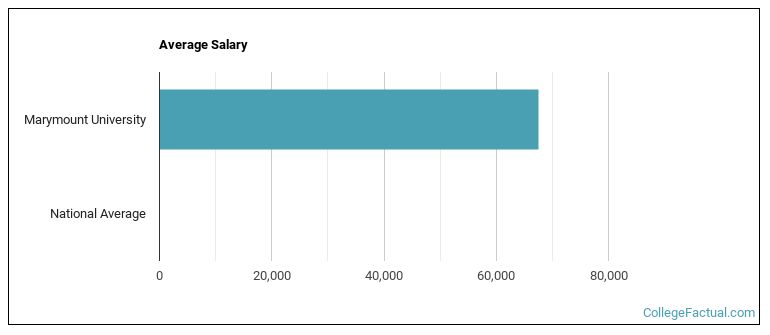
See which majors at Marymount University make the most money.
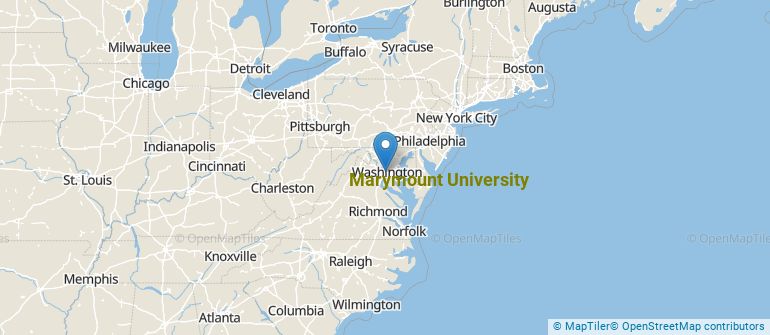
Get more details about the location of Marymount University.
Contact details for Marymount are given below.
| Contact Details | |
|---|---|
| Address: | 2807 N Glebe Rd, Arlington, VA 22207-4299 |
| Phone: | 703-522-5600 |
| Website: | https://www.marymount.edu/ |
| Most Popular Majors | Bachelor’s Degrees | Average Salary of Graduates |
|---|---|---|
| Nursing | 127 | $80,090 |
| Business Administration & Management | 122 | $48,217 |
| Computer Information Systems | 99 | $68,364 |
| Clinical, Counseling & Applied Psychology | 79 | NA |
| Information Technology | 70 | NA |
| Mental & Social Health Services | 63 | NA |
| Design & Applied Arts | 54 | $33,180 |
| Rehabilitation & Therapeutic Professions | 41 | NA |
| General Psychology | 31 | $33,277 |
| Health Sciences & Services | 30 | $25,727 |
Online courses area a great option for busy, working students as well as for those who have scheduling conflicts and want to study on their own time. As time goes by, expect to see more and more online learning options become available.
In 2022-2023, 1,949 students took at least one online class at Marymount University. This is a decrease from the 2,144 students who took online classes the previous year.
| Year | Took at Least One Online Class | Took All Classes Online |
|---|---|---|
| 2022-2023 | 1,949 | 864 |
| 2021-2022 | 2,144 | 603 |
| 2020-2021 | 2,265 | 308 |
| 2018-2019 | 526 | 86 |
If you’re considering Marymount University, here are some more schools you may be interested in knowing more about.
Curious on how these schools stack up against Marymount? Pit them head to head with College Combat, our free interactive tool that lets you compare college on the features that matter most to you!
Footnotes
*The racial-ethnic minorities count is calculated by taking the total number of students and subtracting white students, international students, and students whose race/ethnicity was unknown. This number is then divided by the total number of students at the school to obtain the racial-ethnic minorities percentage.
References
More about our data sources and methodologies.