College Factual recognizes the best colleges and universities in its annual rankings. These rankings include categories for best overall colleges, best colleges for each major, best value schools, and much more.
Mercyhurst University was awarded 4 badges in the 2025 rankings. The highest ranked major at the school is criminal justice & corrections.
Explore the best ranked schools for the programs you are most interested in.
Mercyhurst is ranked #1,310 out of 2,152 schools in the nation for overall quality on College Factual's 2025 Best Colleges list. This is an improvement over the previous year, when Mercyhurst held the #1,689 spot on the Best Overall Colleges list.
Mercyhurst is also ranked #76 out of 103 schools in Pennsylvania.
Mercyhurst University has an acceptance rate of 81%, which makes it somewhat selective. Make sure it's not the only school you apply to, even if it's your school of choice. Whether you get in or not will largely depend on how you compare to other applicants.
The student to faculty ratio is often used to estimate how much interaction there is between professors and their students at a college or university. At Mercyhurst University, this ratio is 14 to 1, which is on par with the national average of 15 to 1. That's not bad at all.
In addition to the student to faculty ratio, some people look at what percentage of faculty members are full-time as a sign of how much time professors will be able to spend with their students. This is because part-time teachers may not be be on campus as much as their full-time counterparts.
The full-time faculty percentage at Mercyhurst University is 63%. This is higher than the national average of 47%.
The freshmen retention rate of 80% tells us that most first-year, full-time students like Mercyhurst University enough to come back for another year. This is a fair bit higher than the national average of 68%. That's certainly something to check off in the good column about the school.
The on-time graduation rate for someone pursuing a bachelor's degree is typically four years. This rate at Mercyhurst for first-time, full-time students is 63%, which is better than the national average of 33.3%.
Find out more about the retention and graduation rates at Mercyhurst University.
During the 2017-2018 academic year, there were 2,370 undergraduates at Mercyhurst with 2,296 being full-time and 74 being part-time.
| $0-30 K | $30K-48K | $48-75 | $75-110K | $110K + |
|---|---|---|---|---|
| $20,668 | $16,338 | $19,112 | $24,611 | $28,955 |
The net price is calculated by adding tuition, room, board and other costs and subtracting financial aid.Note that the net price is typically less than the published for a school. For more information on the sticker price of Mercyhurst, see our tuition and fees and room and board pages.
Almost 66% of college students who graduated with the class of 2018 took out student loans, but that percentage varies from school to school. At Mercyhurst, approximately 82% of students took out student loans averaging $7,928 a year. That adds up to $31,712 over four years for those students.
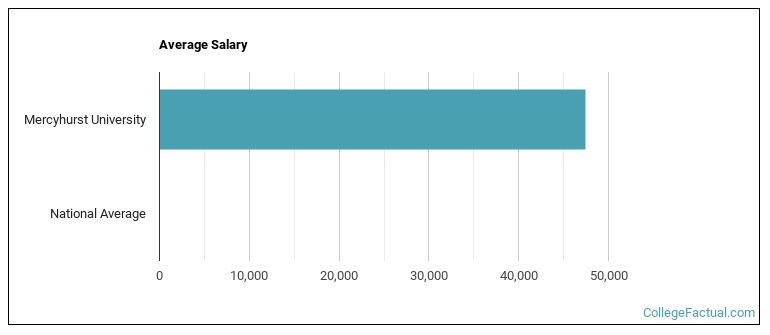
See which majors at Mercyhurst University make the most money.
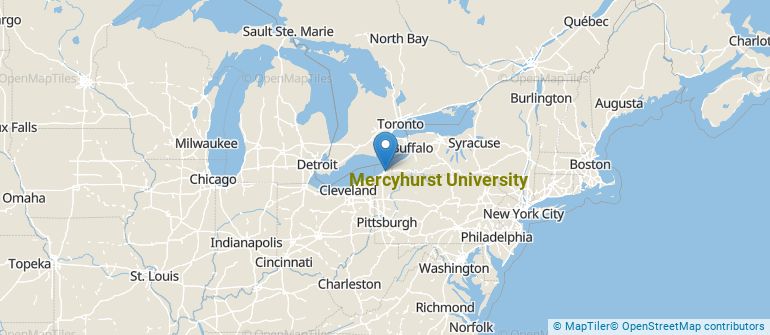
Get more details about the location of Mercyhurst University.
Contact details for Mercyhurst are given below.
| Contact Details | |
|---|---|
| Address: | 501 E 38Th St, Erie, PA 16546 |
| Phone: | 814-824-2000 |
| Website: | www.mercyhurst.edu/ |
| Most Popular Majors | Bachelor’s Degrees | Average Salary of Graduates |
|---|---|---|
| Intelligence & Command Control Operations | 125 | $52,211 |
| Nursing | 95 | $64,519 |
| Criminal Justice & Corrections | 87 | $38,557 |
| Business Administration & Management | 72 | $47,215 |
| Special Education | 48 | $46,636 |
| Information Technology | 42 | NA |
| Allied Health Professions | 37 | NA |
| General Biology | 33 | $29,167 |
| Design & Applied Arts | 24 | $28,267 |
| Teacher Education Grade Specific | 20 | NA |
Online learning options are becoming more and more popular at American colleges and universities. Online classes are great for students who have busy schedules or for those who just want to study on their own time.
In 2022-2023, 182 students took at least one online class at Mercyhurst University. This is a decrease from the 957 students who took online classes the previous year.
| Year | Took at Least One Online Class | Took All Classes Online |
|---|---|---|
| 2022-2023 | 182 | 181 |
| 2021-2022 | 957 | 248 |
| 2020-2021 | 842 | 231 |
| 2018-2019 | 643 | 90 |
If you’re considering Mercyhurst University, here are some more schools you may be interested in knowing more about.
Curious on how these schools stack up against Mercyhurst? Pit them head to head with College Combat, our free interactive tool that lets you compare college on the features that matter most to you!
Footnotes
*The racial-ethnic minorities count is calculated by taking the total number of students and subtracting white students, international students, and students whose race/ethnicity was unknown. This number is then divided by the total number of students at the school to obtain the racial-ethnic minorities percentage.
References
More about our data sources and methodologies.