Below are the key facts about this program at NAU. It is offered at the Bachelor’s level, with graduate study also available. Its best result is a rank of #2 out of 4 schools (Bachelor’s level) by College Factual. Jump to any of the following sections:
College Factual ranks NAU among the top schools in the country for teacher education subject specific, placing at #90 out of 554 schools nationally.
The following degree levels are offered in teacher education subject specific at NAU, along with how many graduates complete each level annually.
| Degree Level | Annual Graduates |
|---|---|
| Bachelor’s | 136 |
| Master’s | 27 |
| Graduate Certificate | 5 |
For the most recent IPEDS reporting year, Northern Arizona University awarded 136 bachelor’s degrees in teacher education subject specific.
NAU is among the very best schools in the country for teacher education subject specific at the bachelor’s level. Specifically, it ranked #2 out of 4 schools by College Factual.
Teacher Education Subject Specific majors who earn their bachelor’s degree from NAU earn a median of $49,640 a year. This is lower than $58,050, the median for all majors at NAU.
To complete a bachelor’s at NAU, teacher education subject specific students accumulate a median of $22,009 in student loans. This is above $21,833, the typical median for all majors at NAU.

Information about average full-time undergraduate tuition and fees is shown in the table below.
| In State | Out of State | |
|---|---|---|
| Tuition | $10,650 | $18,795 |
| Fees | $1,241 | $1,249 |
Read more about NAU tuition and fees.
In the most recent graduating class, 31% of teacher education subject specific bachelor’s degrees went to men and 69% went to women.
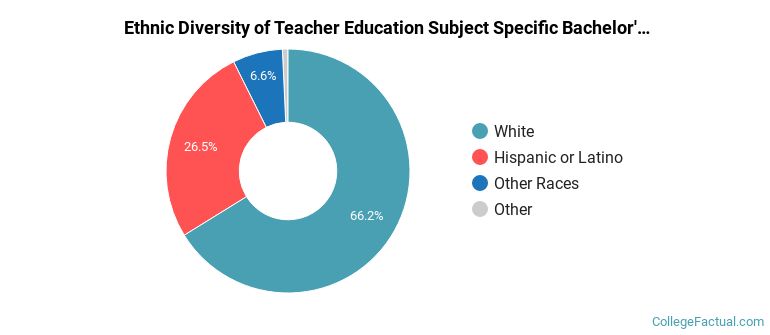
 The majority of teacher education subject specific bachelor’s degree graduates at NAU were White. Roughly 66% of graduates fell into this category.
The following table and chart show the ethnic background for students who recently graduated from Northern Arizona University with a bachelor’s in teacher education subject specific.
| Ethnic Background | Number of Students |
|---|---|
| Asian | 0 |
| Black or African American | 1 |
| Hispanic or Latino | 36 |
| White | 90 |
| Non-Resident Aliens | 0 |
| Other Races | 9 |
NAU conferred 34 bachelor’s completions in english/language arts teacher education in the most recent reporting year — 88% to women and 12% to men. The most common background among these graduates was White (65%).
NAU conferred 26 bachelor’s completions in history teacher education in the most recent reporting year — 46% to women and 54% to men. The largest share of these graduates were White (73%).
NAU conferred 14 bachelor’s degrees in music teacher education recently — 50% to women and 50% to men. The largest share of these graduates were White (71%).
NAU granted 14 bachelor’s completions in technical teacher education in the latest year of data — 86% to women and 14% to men. The largest share of these graduates were White (57%).
NAU granted 13 bachelor’s completions in art teacher education in the most recent reporting year — 100% to women and 0% to men. The largest share of these graduates were White (54%).
NAU granted 9 bachelor’s degrees in physical education teaching and coaching in the latest year of data — 56% to women and 44% to men. The largest share of these graduates were White (56%).
NAU granted 7 bachelor’s completions in mathematics teacher education in the latest year of data — 71% to women and 29% to men. The largest share of these graduates were White (86%).
NAU granted 6 bachelor’s degrees in biology teacher education in the most recent reporting year — 67% to women and 33% to men. The most common background among these graduates was White (83%).
NAU granted 5 bachelor’s degrees in physics teacher education in the most recent reporting year — 20% to women and 80% to men. The largest share of these graduates were White (60%).
NAU awarded 4 bachelor’s completions in earth science teacher education recently — 50% to women and 50% to men. The largest share of these graduates were White (100%).
NAU granted 2 bachelor’s completions in science teacher education/general science teacher education recently — 50% to women and 50% to men. The most common background among these graduates was Hispanic or Latino (50%).
NAU conferred 2 bachelor’s completions in spanish language teacher education in the most recent reporting year — 100% to women and 0% to men. Most of these graduates identified as Hispanic or Latino (50%).
This program is also offered at the graduate level at NAU. The following graduate award levels are reported.
| Graduate Level | Annual Graduates |
|---|---|
| Master’s Degrees in Teacher Education Subject Specific | 27 |
| Graduate Certificate Degrees in Teacher Education Subject Specific | 5 |
