RPI total enrollment is approximately 7,501 students. 6,262 are undergraduates and 1,139 are graduate students.
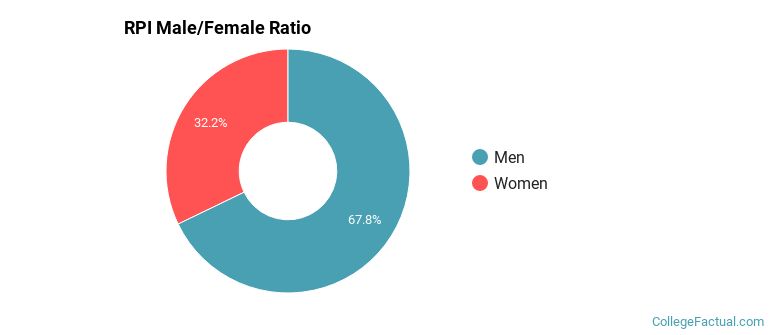
Male/Female Breakdown of Undergraduates
The full-time RPI undergraduate population is made up of 31% women, and 69% men.
For the gender breakdown for all students, go here.
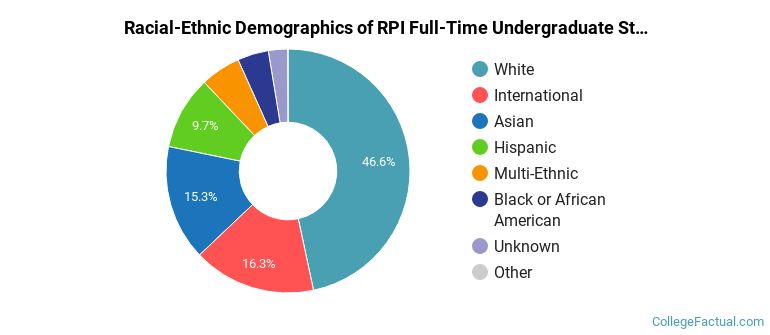
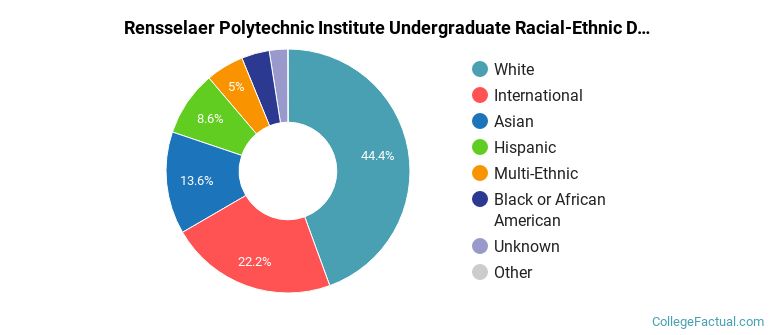
RPI Racial/Ethnic Breakdown of Undergraduates
| Race/Ethnicity | Number |
|---|---|
| White | 2,749 |
| Asian | 1,044 |
| International | 1,003 |
| Hispanic | 663 |
| Black or African American | 292 |
| Multi-Ethnic | 291 |
| Unknown | 209 |
| Native Hawaiian or Pacific Islander | 0 |
See racial/ethnic breakdown for all students.
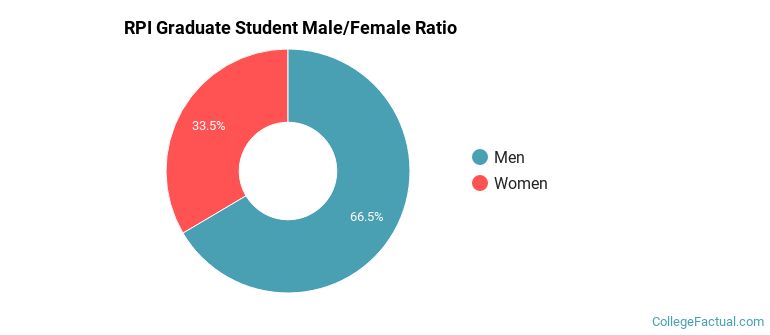
Male/Female Breakdown of Graduate Students
About 32% of full-time grad students are women, and 68% men.
For the gender breakdown for all students, go here.
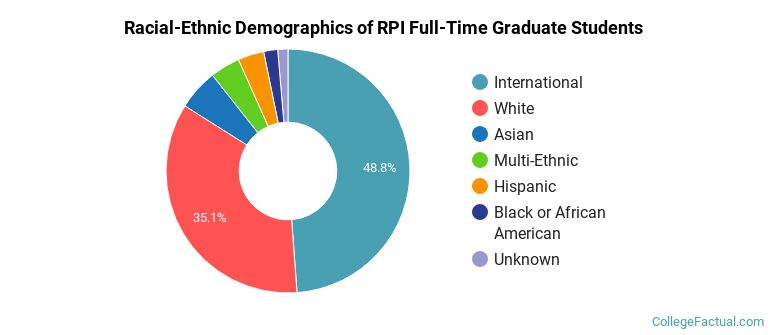
RPI Racial-Ethnic Breakdown of Graduate Students
| Race/Ethnicity | Number |
|---|---|
| International | 469 |
| White | 453 |
| Asian | 72 |
| Hispanic | 60 |
| Multi-Ethnic | 44 |
| Black or African American | 26 |
| Unknown | 13 |
| Native Hawaiian or Pacific Islander | 1 |
See racial/ethnic breakdown for all students.
| Race/Ethnicity | Number |
|---|---|
| White | 3,239 |
| International | 1,528 |
| Asian | 1,118 |
| Hispanic | 724 |
| Multi-Ethnic | 336 |
| Black or African American | 319 |
| Unknown | 224 |
| Native Hawaiian or Pacific Islander | 1 |

There are approximately 2,359 female students and 5,142 male students at RPI.
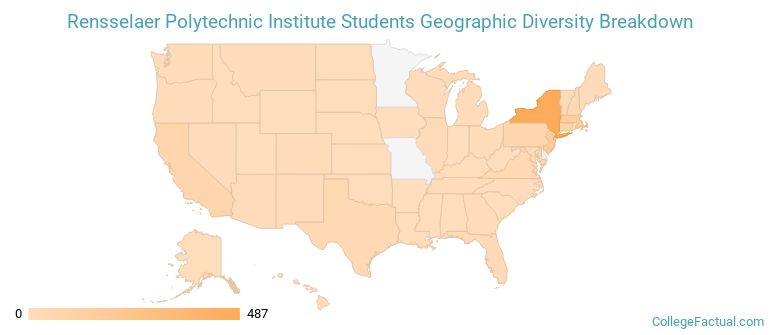
RPI ranks 105 out of 2,183 when it comes to geographic diversity.
67.16% of RPI students come from out of state, and 11.47% come from out of the country.
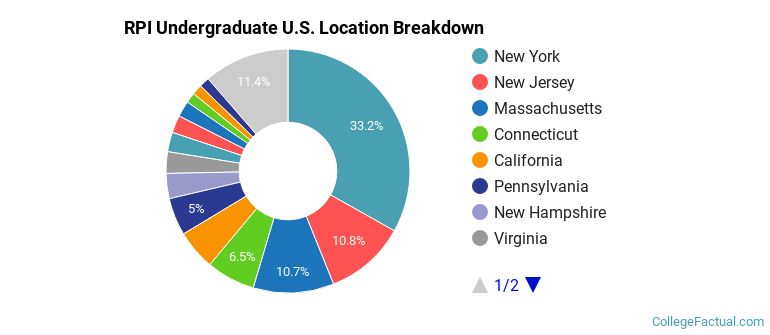
The undergraduate student body is split among 46 states (may include Washington D.C.). Click on the map for more detail.
| State | Amount |
|---|---|
| New York | 487 |
| New Jersey | 158 |
| Massachusetts | 157 |
| Connecticut | 95 |
| California | 78 |
Students from 69 countries are represented at this school, with the majority of the international students coming from China, India, and Canada.
Learn more about international students at RPI.
A traditional college student is defined as being between the ages of 18-21. At RPI, 73.50% of students fall into that category, compared to the national average of 60%.
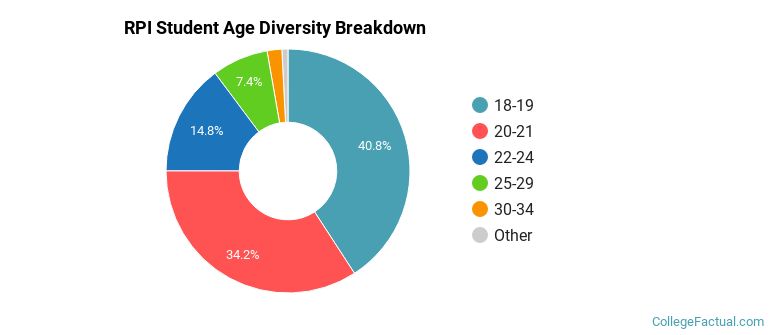
| Student Age Group | Amount |
|---|---|
| 18-19 | 3,037 |
| 20-21 | 2,543 |
| 22-24 | 1,100 |
| 25-29 | 554 |
| 30-34 | 145 |
| 35 and over | 60 |
| Under 18 | 0 |
Footnotes
*The racial-ethnic minorities count is calculated by taking the total number of students and subtracting white students, international students, and students whose race/ethnicity was unknown. This number is then divided by the total number of students at the school to obtain the racial-ethnic minorities percentage.
References
Department of Homeland Security Citizenship and Immigration Services
Image Credit: By UpstateNYer under License
Read College Factual's Diversity Ranking Methodology.