We’ve pulled together the essential facts you should know about the program at Stanford University. You can study it at the Bachelor’s level, with graduate study also available. Its best result is a rank of #1 out of 49 schools (Bachelor’s level) by College Factual. Jump to any of the following sections:
College Factual ranks Stanford University as a strong choice for political science & government, ranked #10 out of 679 schools nationally.
| Ranking | Rank |
|---|---|
| Best Political Science & Government Schools | 10 of 679 |
| Best Political Science & Government Schools in California | 1 of 112 |
The table below lists every degree level offered in political science & government at Stanford University, along with how many graduates complete each level annually.
| Degree Level | Annual Graduates |
|---|---|
| Bachelor’s | 88 |
| Master’s | 5 |
| Doctoral | 15 |
For the most recent IPEDS reporting year, Stanford University handed out 88 bachelor’s degrees in political science & government.
Stanford University is among the very best schools in the country for political science & government at the bachelor’s level. Its best result was #1 out of 49 schools by College Factual.
Political Science & Government students who finish a bachelor’s at Stanford University report a median salary of $75,464 a year. This is below $153,326, the median for all majors at Stanford University.
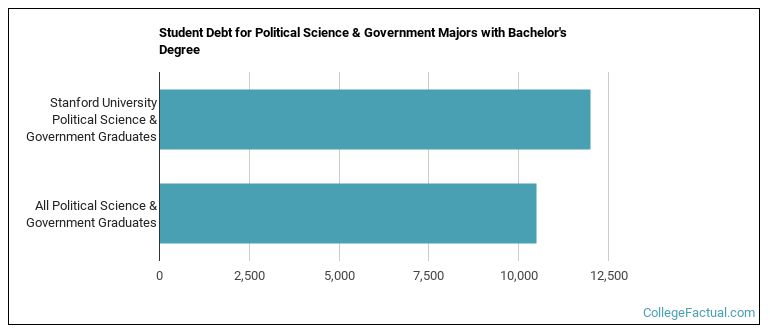
Earning a bachelor’s degree at Stanford University, political science & government students accumulate a median of $12,000 in student loans. This is higher than $10,492, the typical median for all majors at Stanford University.
Information about average full-time undergraduate tuition and fees is shown in the table below.
| In State | Out of State | |
|---|---|---|
| Tuition | $55,473 | $65,127 |
| Fees | $783 | $783 |
Find out more about Stanford University tuition and fees.
Among recent graduates, 34% of political science & government bachelor’s degrees went to men and 66% went to women.
 The largest share of political science & government bachelor’s degree graduates at Stanford University are White. Approximately 42% of graduates fell into this category.
The following table and chart show the ethnic background for students who recently graduated from Stanford University with a bachelor’s in political science & government.
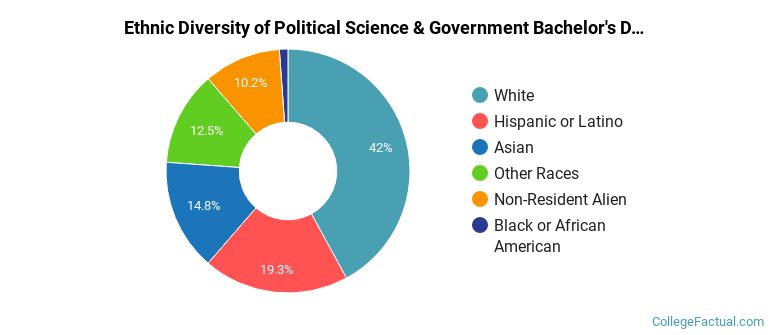
| Ethnic Background | Number of Students |
|---|---|
| Asian | 13 |
| Black or African American | 1 |
| Hispanic or Latino | 17 |
| White | 37 |
| Non-Resident Aliens | 9 |
| Other Races | 11 |
Stanford University conferred 88 bachelor’s degrees in political science and government, general in the most recent reporting year — 66% to women and 34% to men. The largest share of these graduates were White (42%).
You can also pursue this field at the graduate level at Stanford University. Annual graduate completions by level are shown below.
| Graduate Level | Annual Graduates |
|---|---|
| Master’s Degrees in Political Science & Government | 5 |
| Doctoral Degrees in Political Science & Government | 15 |
