We’ve pulled together the essential facts you should know about the program at Union University. You can study it at the Bachelor’s level, with graduate study also available. Its best result is a rank of #8 out of 26 schools (Bachelor’s level) by College Factual. Jump to any of the following sections:
By College Factual’s measure, Union University among the top schools in the country for nursing, coming in at #892 out of 1,956 schools nationally.
| Ranking | Rank |
|---|---|
| Best Nursing Schools | 892 of 1,956 |
| Best Nursing Schools in Tennessee | 14 of 44 |
| Best Nursing Schools in the Southeast Region | 176 of 550 |
Here is each degree level available for nursing at Union University, along with how many graduates complete each level annually.
| Degree Level | Annual Graduates |
|---|---|
| Bachelor’s | 120 |
| Master’s | 17 |
| Doctoral | 37 |
| Professional Certificate | 6 |
In the most recent year for which we have data, Union University awarded 120 bachelor’s degrees in nursing.
Union University is in the top 5% of the country for nursing at the bachelor’s level. Its best result was #8 out of 26 schools by College Factual.
| Ranking | Rank |
|---|---|
| Best Nursing Bachelor’s Degree Schools in Tennessee | 8 |
| Best Nursing Bachelor’s Degree Schools in the Southeast Region | 120 |
| Best Nursing Bachelor’s Degree Schools | 560 |
Nursing majors who earn their bachelor’s degree from Union University earn a median of $69,709 a year. This is above $65,440, the median for all majors at Union University.
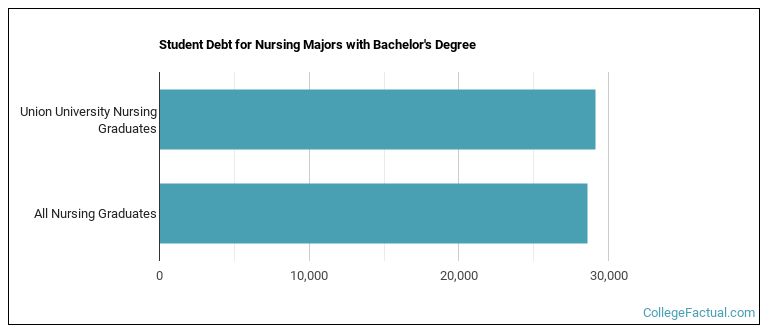
While getting their bachelor’s degree at Union University, nursing students accumulate a median of $29,127 in student loans. This is higher than $28,605, the typical median for all majors at Union University.
Average full-time tuition and fees are listed in the table below.
| In State | Out of State | |
|---|---|---|
| Tuition | $34,320 | $36,005 |
| Fees | $1,393 | $1,393 |
Read more about Union University tuition and fees.
In the most recent graduating class, 14% of nursing bachelor’s degrees went to men and 86% went to women.
 The largest share of nursing bachelor’s degree graduates at Union University are White. Approximately 53% of graduates fell into this category.
The following table and chart show the ethnic background for students who recently graduated from Union University with a bachelor’s in nursing.
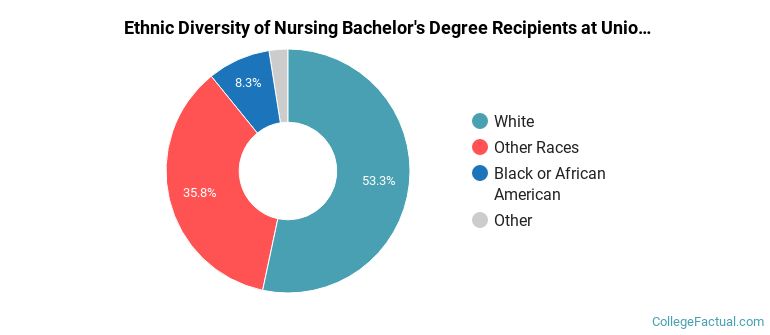
| Ethnic Background | Number of Students |
|---|---|
| Asian | 1 |
| Black or African American | 10 |
| Hispanic or Latino | 1 |
| White | 64 |
| Non-Resident Aliens | 1 |
| Other Races | 43 |
Union University conferred 120 bachelor’s degrees in registered nursing/registered nurse recently — 86% to women and 14% to men. Most of these graduates identified as White (53%).
You can also pursue this field at the graduate level at Union University. Here are the graduate award levels offered.
| Graduate Level | Annual Graduates |
|---|---|
| Master’s Degrees in Nursing | 17 |
| Doctoral Degrees in Nursing | 37 |
| Professional Certificate Degrees in Nursing | 6 |
