We've gathered data and other essential information about the program, such as the average salary of graduates, ethnicity of students, how many students graduated in recent times, and more. We've also included details on how UIUC ranks compared to other colleges offering a major in me.
Jump to any of the following sections:
UIUC is in the top 10% of the country for me. More specifically it was ranked #23 out of 317 schools by College Factual. It is also ranked #2 in Illinois.
During the 2020-2021 academic year, University of Illinois at Urbana-Champaign handed out 210 bachelor's degrees in mechanical engineering. This is an increase of 17% over the previous year when 179 degrees were handed out.
In 2021, 61 students received their master’s degree in me from UIUC. This makes it the #36 most popular school for me master’s degree candidates in the country.
In addition, 29 students received their doctoral degrees in me in 2021, making the school the #11 most popular school in the United States for this category of students.
ME majors who earn their bachelor's degree from UIUC go on to jobs where they make a median salary of $68,804 a year. This is higher than $65,190, which is the national median for all me bachelor's degree recipients.

Graduates of the master's me program at UIUC make a median salary of $87,643. This is a better than average outcome since the median salary for all me graduates with a master's is $81,943.

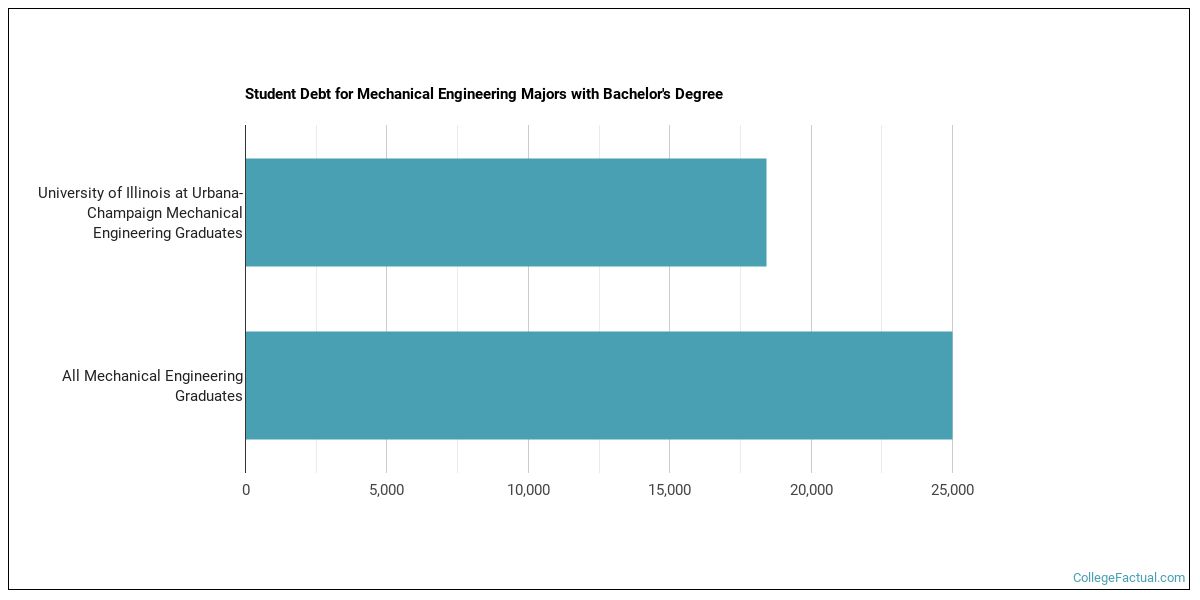
While getting their bachelor's degree at UIUC, me students borrow a median amount of $20,500 in student loans. This is not too bad considering that the median debt load of all me bachelor's degree recipients across the country is $25,000.
The typical student loan payment of a bachelor's degree student from the me program at UIUC is $583 per month.
Take a look at the following statistics related to the make-up of the me majors at University of Illinois at Urbana-Champaign.
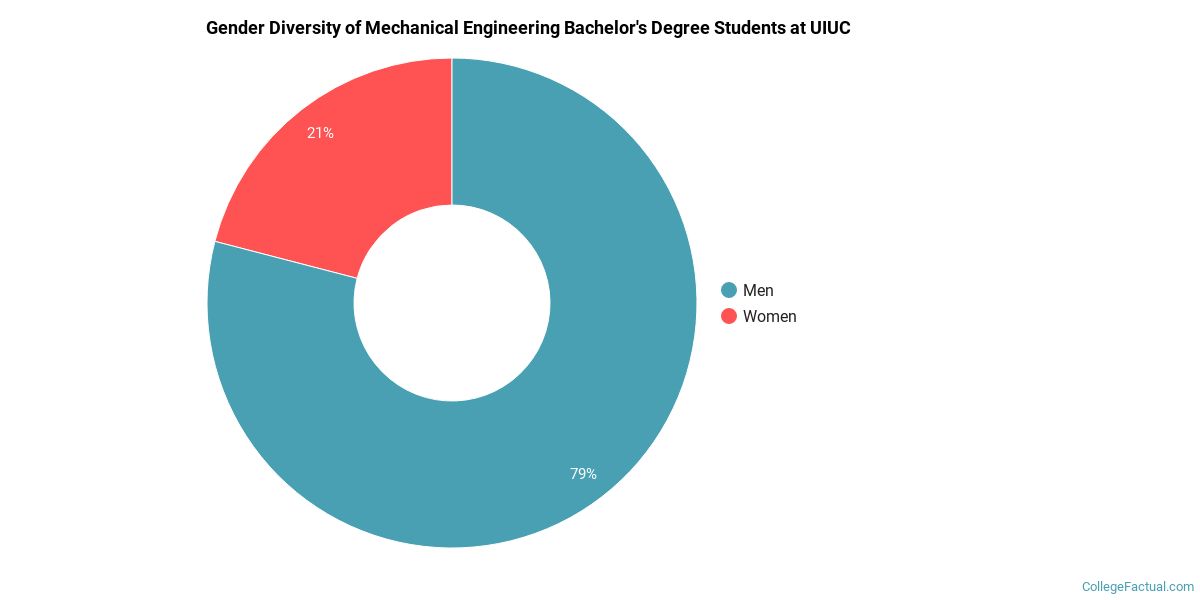
During the 2020-2021 academic year, 210 me majors earned their bachelor's degree from UIUC. Of these graduates, 79% were men and 21% were women.
The following table and chart show the ethnic background for students who recently graduated from University of Illinois at Urbana-Champaign with a bachelor's in me.

| Ethnic Background | Number of Students |
|---|---|
| Asian | 41 |
| Black or African American | 4 |
| Hispanic or Latino | 22 |
| White | 95 |
| Non-Resident Aliens | 43 |
| Other Races | 5 |
The me program at UIUC awarded 61 master's degrees in 2020-2021. About 85% of these degrees went to men with the other 15% going to women.

The following table and chart show the ethnic background for students who recently graduated from University of Illinois at Urbana-Champaign with a master's in me.

| Ethnic Background | Number of Students |
|---|---|
| Asian | 1 |
| Black or African American | 0 |
| Hispanic or Latino | 0 |
| White | 17 |
| Non-Resident Aliens | 41 |
| Other Races | 2 |
| Related Major | Annual Graduates |
|---|---|
| Electrical Engineering | 463 |
| Computer Engineering | 422 |
| Civil Engineering | 403 |
| Chemical Engineering | 181 |
| Aerospace & Aeronautical Engineering | 154 |
More about our data sources and methodologies.
