We've pulled together some essential information you should know about the program, including how many students graduate each year, the ethnic diversity of these students, average starting salaries, and more. In addition, we cover how UMBC ranks in comparison to other schools with sociology programs.
Jump to any of the following sections:
The bachelor's program at UMBC was ranked #163 on College Factual's Best Schools for sociology list. It is also ranked #3 in Maryland.
| Ranking Type | Rank |
|---|---|
| Best Sociology Master’s Degree Schools | 16 |
| Best Sociology Graduate Degree Schools | 23 |
| Best Sociology Schools | 163 |
| Best Sociology Bachelor’s Degree Schools | 169 |
During the 2021-2022 academic year, University of Maryland - Baltimore County handed out 49 bachelor's degrees in sociology. This is an increase of 2% over the previous year when 48 degrees were handed out.
In 2022, 7 students received their master’s degree in sociology from UMBC. This makes it the #51 most popular school for sociology master’s degree candidates in the country.
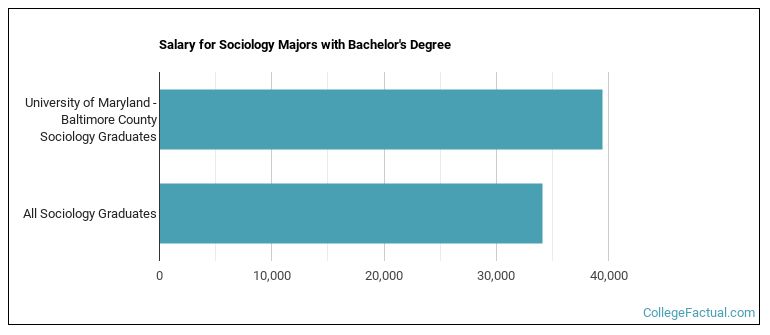
The median salary of sociology students who receive their bachelor's degree at UMBC is $39,435. This is higher than $34,105, which is the national median for all sociology bachelor's degree recipients.
During the 2022-2023 academic year, part-time undergraduate students at UMBC paid an average of $1,103 per credit hour if they came to the school from out-of-state. In-state students paid a discounted rate of $382 per credit hour. The following table shows the average full-time tuition and fees for undergraduates.
| In State | Out of State | |
|---|---|---|
| Tuition | $9,238 | $26,594 |
| Fees | $3,714 | $3,714 |
| Books and Supplies | $1,600 | $1,600 |
| On Campus Room and Board | $14,204 | $14,204 |
| On Campus Other Expenses | $3,414 | $3,414 |
Learn more about UMBC tuition and fees.
During the 2021-2022 academic year, 49 students graduated with a bachelor's degree in sociology from UMBC. About 37% were men and 63% were women.

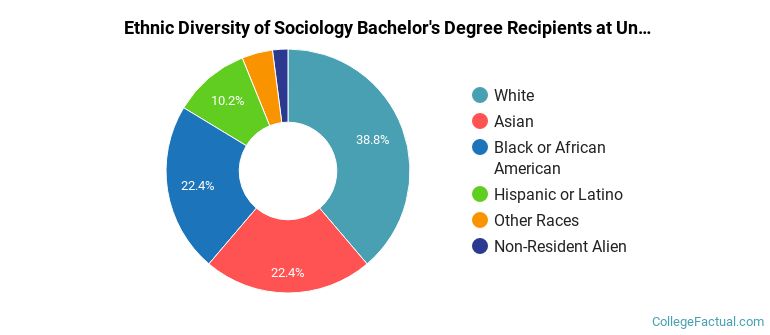
The following table and chart show the ethnic background for students who recently graduated from University of Maryland - Baltimore County with a bachelor's in sociology.
| Ethnic Background | Number of Students |
|---|---|
| Asian | 11 |
| Black or African American | 11 |
| Hispanic or Latino | 5 |
| White | 19 |
| Non-Resident Aliens | 1 |
| Other Races | 2 |
UMBC does not offer an online option for its sociology bachelor’s degree program at this time. To see if the school offers distance learning options in other areas, visit the UMBC Online Learning page.
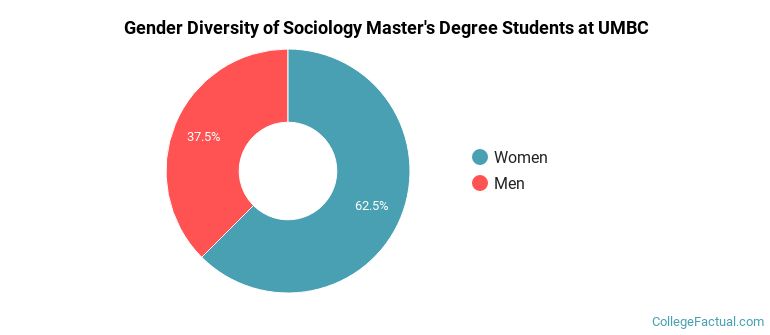
For the most recent academic year available, 38% of sociology master's degrees went to men and 63% went to women.
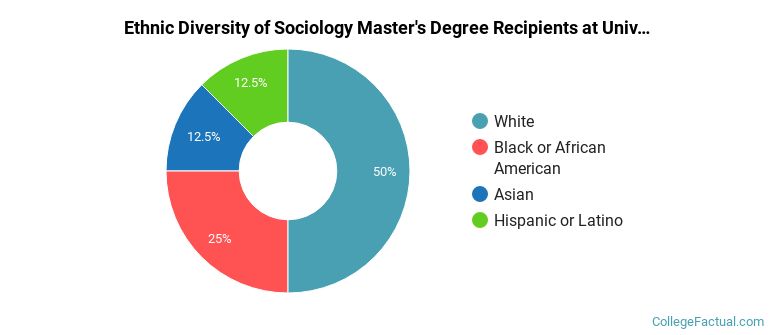
The following table and chart show the ethnic background for students who recently graduated from University of Maryland - Baltimore County with a master's in sociology.
| Ethnic Background | Number of Students |
|---|---|
| Asian | 1 |
| Black or African American | 2 |
| Hispanic or Latino | 1 |
| White | 4 |
| Non-Resident Aliens | 0 |
| Other Races | 0 |
Take a look at the following statistics related to the make-up of the sociology majors at University of Maryland - Baltimore County.
| Related Major | Annual Graduates |
|---|---|
| Economics | 114 |
| Political Science & Government | 87 |
| Anthropology | 11 |
| Geography & Cartography | 9 |
| International Relations & National Security | 7 |
More about our data sources and methodologies.