Below are the key facts about this program at UNC Asheville. You can study it at the Bachelor’s level. Jump to any of the following sections:
The following degree levels are granted in economics at UNC Asheville, along with how many graduates complete each level annually.
| Degree Level | Annual Graduates |
|---|---|
| Bachelor’s | 14 |
During the most recent reporting year, University of North Carolina Asheville awarded 14 bachelor’s degrees in economics.
UNC Asheville is not yet ranked for economics at the bachelor’s level.
Economics graduates with a bachelor’s degree from UNC Asheville report a median salary of $52,466 a year. This is above $40,267, the median for all majors at UNC Asheville.
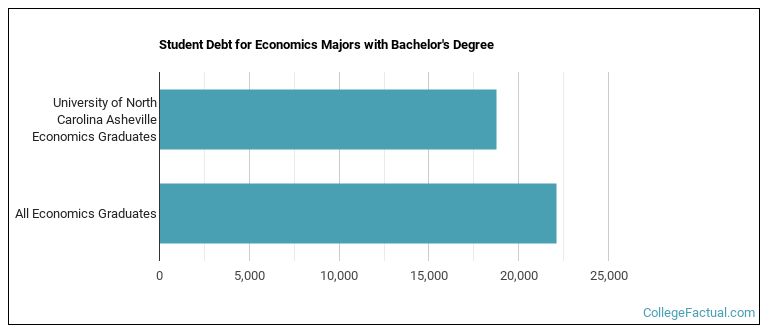
While getting their bachelor’s degree at UNC Asheville, economics students accumulate a median of $18,791 in student loans. This is below $22,108, the typical median for all majors at UNC Asheville.
The full-time undergraduate tuition and fees are shown below.
| In State | Out of State | |
|---|---|---|
| Tuition | $4,122 | $21,470 |
| Fees | $3,379 | $3,379 |
Find out more about UNC Asheville tuition and fees.
In the most recent graduating class, 71% of economics bachelor’s degrees went to men and 29% went to women.
 The largest share of economics bachelor’s degree graduates at UNC Asheville are White. Roughly 71% of graduates fell into this category.
The following table and chart show the ethnic background for students who recently graduated from University of North Carolina Asheville with a bachelor’s in economics.
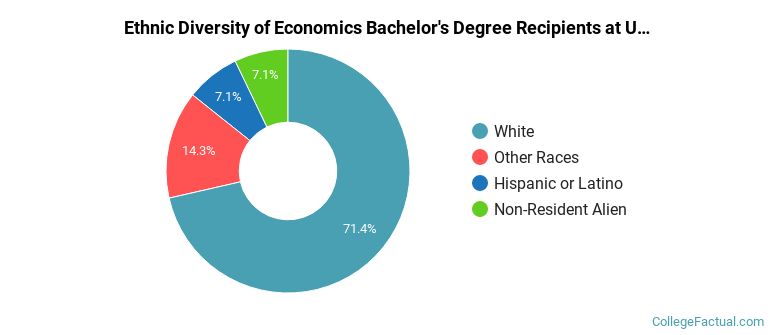
| Ethnic Background | Number of Students |
|---|---|
| Asian | 0 |
| Black or African American | 0 |
| Hispanic or Latino | 1 |
| White | 10 |
| Non-Resident Aliens | 1 |
| Other Races | 2 |
