Go directly to any of the following sections:
The bachelor's program at WKU was ranked #283 on College Factual's Best Schools for liberal arts / sciences & humanities list. It is also ranked #2 in Kentucky.
During the 2021-2022 academic year, Western Kentucky University handed out 138 bachelor's degrees in liberal arts / sciences & humanities. This is a decrease of 3% over the previous year when 142 degrees were handed out.
Learn about other programs related to Liberal Arts / Sciences & Humanities that might interest you.
Maximize your transfer credits and complete your bachelor's degree faster with this flexible online bachelor's from Southern New Hampshire University.
In 2022-2023, the average part-time undergraduate tuition at WKU was $1,125 per credit hour for out-of-state students. The average for in-state students was $477 per credit hour. The average full-time tuition and fees for undergraduates are shown in the table below.
| In State | Out of State | |
|---|---|---|
| Tuition | $11,436 | $27,000 |
| Books and Supplies | $1,000 | $1,000 |
| On Campus Room and Board | $12,043 | $12,043 |
| On Campus Other Expenses | $2,409 | $2,409 |
Learn more about WKU tuition and fees.
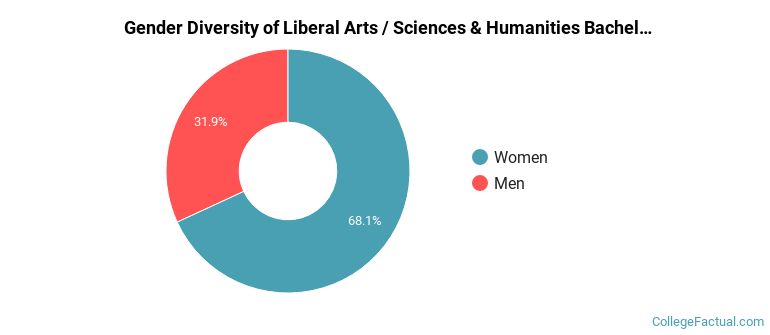
During the 2021-2022 academic year, 138 liberal arts / sciences & humanities majors earned their bachelor's degree from WKU. Of these graduates, 32% were men and 68% were women.
The majority of the students with this major are white. About 78% of 2022 graduates were in this category.
The following table and chart show the ethnic background for students who recently graduated from Western Kentucky University with a bachelor's in liberal arts / sciences & humanities.
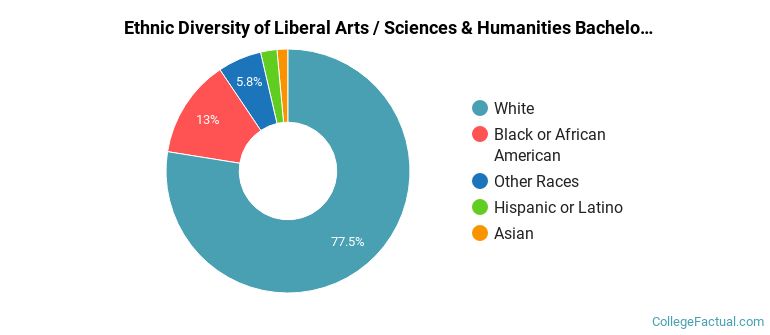
| Ethnic Background | Number of Students |
|---|---|
| Asian | 2 |
| Black or African American | 18 |
| Hispanic or Latino | 3 |
| White | 107 |
| Non-Resident Aliens | 0 |
| Other Races | 8 |
If you’re one of the many students who want the flexibility of distance learning courses, you’ll be happy to hear that WKU offers online option in its liberal arts / sciences & humanities bachelor’s degree program. To see if the school offers distance learning options in other areas, visit the WKU Online Learning page.
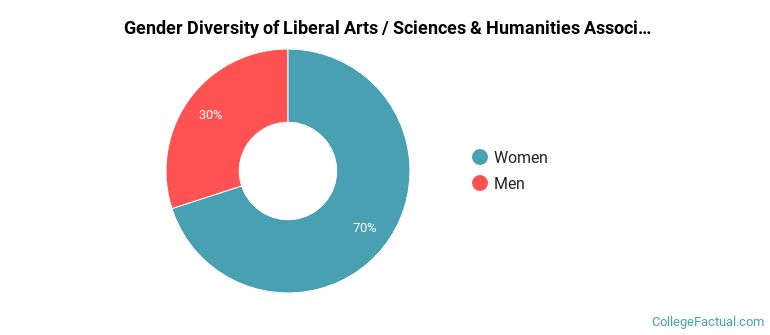
During the 2021-2022 academic year, 40 students graduated with a associate's degree in liberal arts / sciences & humanities from WKU. About 30% were men and 70% were women.
The majority of the students with this major are white. About 75% of 2022 graduates were in this category.
The following table and chart show the ethnic background for students who recently graduated from Western Kentucky University with a associate's in liberal arts / sciences & humanities.
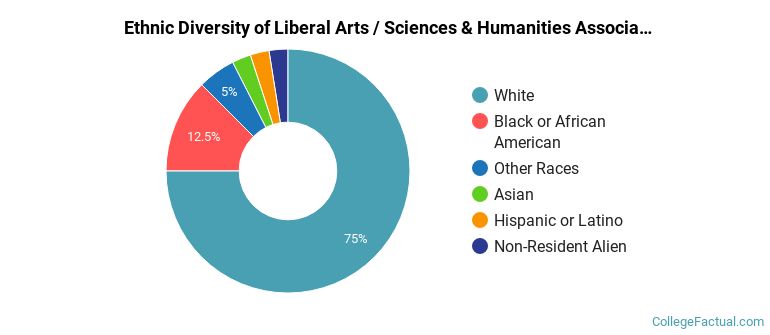
| Ethnic Background | Number of Students |
|---|---|
| Asian | 1 |
| Black or African American | 5 |
| Hispanic or Latino | 1 |
| White | 30 |
| Non-Resident Aliens | 1 |
| Other Races | 2 |
Take a look at the following statistics related to the make-up of the liberal arts / sciences & humanities majors at Western Kentucky University.
Liberal Arts / Sciences & Humanities students may decide to major in one of the following focus areas. Individual majors may not be available for all degree levels.
| Major | Annual Graduates |
|---|---|
| Liberal Arts General Studies | 178 |
| Related Major | Annual Graduates |
|---|---|
| Social Sciences | 300 |
| Communication & Journalism | 267 |
| Family, Consumer & Human Sciences | 66 |
| English Language & Literature | 56 |
| Foreign Languages & Linguistics | 35 |
View All Liberal Arts / Sciences & Humanities Related Majors >
More about our data sources and methodologies.
